Experience with passive monitoring deployment
Sven Ubik, Aleˇs Friedl, CESNET, Czech Republic
Keywords: passive network monitoring
10 Gb/s monitoring. There are several models, which differin type of PCI bus (PCI-X, PCI-E), link technology (Ether-
net, PoS) and ability to split packets into multiple buffers
Passive network monitoring, which observes directly real
network traffic, can provide network characteristics useful
We use DiMAPI (Distributed Monitoring API) middle-
for performance assessment, troubleshooting and network
ware (R2) developed in SCAMPI [4] and LOBSTER [5]
planning, which cannot be obtained by other means [1].
projects that we extended with new monitoring functions
In this paper we describe our experience with the pilot
for Packetloss application (see section IV).
deployment of passive monitoring on selected GEANT2-
DiMAPI and its concept of separate libraries of drivers
NREN (National Research and Educational Network) bor-
and monitoring functions for different monitoring cards al-
der links, to verify concept viability, technology suitability,
lowed us to run all applications on remote monitoring sta-
performance and application usefulness.
tions with various hardware setup (R3). Each direction ofone link can be sent to the same monitoring port, different
port, different card or different server. Where possible mul-
We set forth several requirements (R) to be satisfied by
tiple virtual devices are created to utilize multi-core CPUs.
the developed and deployed monitoring architecture:
Applications can still run completely transparently in thisenvironment unaware of local setup.
• R1 - Lossless monitoring of production 10 Gb/s links. While some applications can tolerate sampling, other ap-
The architecture is shown in Fig. 1. Data processing is di-
plications require that all packets are processed with zero
vided into three parts. Mapid daemon runs on the PCs with
monitoring cards. It uses dynamic libraries for differentmonitoring cards to implement DiMAPI monitoring func-
• R2 - Multiple concurrent applications running over thesame monitoring cards to limit cost, space, power and man-
tions and sends their results through mapicommd daemon
to the central station. DiMAPI library linked to the applica-tion retrieves results from mapicommd daemons. The appli-
• R3 - Seamless operation of applications in heterogenoushardware environment with different link-layer technolo-
cation itself further processes monitored data and presents
gies and different ways to tap packets.
• R4 - Providing novel applications with added value overother types of monitoring to significantly enhance our un-
The deployed architecture is described in the next section
with references to requirements (R1-3) as they are covered.
Applications (R4) are described in section IV.
In the pilot project we deployed monitoring infrastruc-
ture over four GEANT2-NREN links at ACAD, CESNET,PIONIER and SWITCH. ACAD uses Gigabit Ethernet link,
PIONIER uses 10 Gb/s PoS (OC-192) link and CESNET
and SWITCH use 10 Gigabit Ethernet links.
Current 10 Gb/s Ethernet NICs have low throughput for
short packets and cannot be used for passive monitoring,where we need to capture large volumes of network trafficin various packet sizes [2].
Fig. 1. Architecture of passive monitoring based on DiMAPI middleware
Therefore, monitoring cards such as DAG or Napatech
We deployed monitoring stations on border links be-
need to be used (R1). The main task of these cards is to
tween the GEANT2 network and participating NRENs.
efficiently copy packets from the network to the operating
Therefore we monitor traffic entering NRENs, leaving
system memory of the host PC, where they are taken up and
processed by applications. The monitoring cards can copypackets at full line rate (10 Gb/s) for all packet sizes with
near zero CPU load, so that CPU remains fully available forpacket processing.
We have deployed several novel monitoring applications
At the time of procuring hardware for our pilot, only
(R4) that provide interesting characteristics which can only
DAG [3] cards from Endace company were available for
be obtained from passive monitoring.
ABW [6] measures link load in short time intervals (1s).
When compared to SNMP monitoring, passive link loadmonitoring can provide results at any time scale. This en-ables the detection of short load peaks that are often muchhigher than long term averages. These peaks cannot be de-tected by SNMP monitoring, because routers normally up-date their MIB (Management Information Base) counterswith varying delays of several seconds.
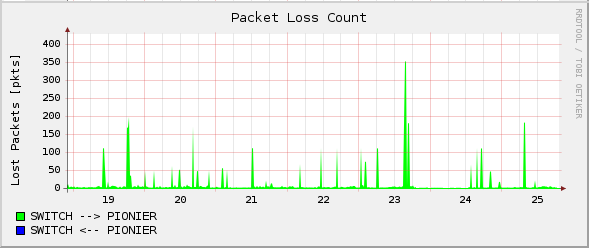
Fig. 3. Monitoring packet loss of real traffic
ABW also shows distribution of traffic into protocols at
different layers of OSI hierarchy including most common
when no packet of the flow arrives during a specified in-
application-layer protocols that use dynamic ports (FTP,
active period (the default is 30 seconds). Flow records are
BitTorrent, etc.). Example graph of short-term dynamics
periodically retrieved by the Packetloss application which
protocol distribution is shown in Fig. 2.
Packetloss can monitor loss in all or subset of traffic be-
tween multiple network edge points (in our case among var-ious GEANT2-NREN points). Example graph of packetsloss in real traffic from SWITCH to PIONIER over a pe-riod of one week is shown in Fig. 3. The graph shows thenumber of lost packets during individual 30-minute inter-vals. Active packet loss monitoring also deployed in theGEANT2 network did not detect any losses on this pathover the same period. A number of other characteristics canbe presented in tabular or graphical form. This includes to-tal number of observed flows on each monitoring stationas well as packet loss rate and number of flows passingbetween each pair of monitoring stations. Detailed list offlows that suffered from losses can be also printed. See sec-tion VII for discussion of performance parameters.
Fig. 2. Capacity usage and protocol monitoring by ABW
Packetloss is a radically novel application that monitors
Tbwtools [7] does TCP throughput test with diagnosis.
packet loss of real user traffic. While test packets can be
It is a hybrid application that combines active monitor-
used to measure network delay, it is not possible to use them
ing, passive monitoring to capture connection packets for
to measure packet loss happening in the network. The vol-
analysis and end-host monitoring by observing TCP INFO
ume and dynamics of real user traffic is varying and by or-
socket option and web100 Linux kernel extension variables.
ders of magnitude different than test packets possibly sent
Information from all sources is time-correlated and pre-
sented in a set of graphs for expert performance analysis.
Let us illustrate the problem. Suppose that 10 test pack-
ets per second were sent between two end points (much
more than in the active monitoring deployed in GEANT2). It would take almost 3 hours to detect packet loss of 10-5
Burst [8] quantifies traffic dynamics independently of
and more than a day to detect 10-6. Moreover, these cal-
any time periods by classification of sizes of packet bursts
culations are valid for evenly distributed packet loss. When
or inter-burst spaces. Distribution function of burst sizes
bursts of packet loss occur, which is a common case, it can
is presented in 2D or 3D graphs, the latter showing time
take an even longer time to detect and realistically measure
packet loss rate by test packets. The problem can also be
looked at from another perspective: If a burst of 10 testpackets was sent and a loss period was caught, so that 5 out
Performance characteristics collected over a period of
of 10 packets were lost, it would not be possible to deter-
one week are summarized in Table I. It shows maximum
mine the time period for which this 50% packet loss rate is
load on the monitored links (obtained from ABW) and max-
valid. Packet loss is a property inherent to traffic in which
imum CPU usage as 5-minute averages, total number of
it is experienced. Due to the volume and dynamics of real
processed packets and the number of packets dropped due
traffic, it is not possible to realistically capture its packet
to monitoring card buffer overflow. CPU usage is indicated
for CPU cores that ran mapid daemons, which do actual
The basic idea of Packetloss is to compare the number of
packet processing. Other CPU cores were lightly loaded.
packets reported in the same flow from multiple monitoring
SWITCH stations use monitoring cards that split packets
stations. If the number of packets is different, it is the real
into two buffers, therefore two CPU cores were utilized.
packet loss which happened inside the network. The im-
PIONIER stations use monitoring cards that did not pro-
plementation is rather complex for achieving required per-
vide optimal performance for the PoS links and will be re-
formance properties. The flow record is created on a mon-
placed by a newer type. CPUs have still significant reserve
itoring station when a flow expires (or completes); that is
of power on these stations. CESNET station ran on an older
PC deployed before the pilot. It was recently replaced by a
[6] S. Ubik, A. Oslebo, D. Antoniades, ABW - Short-timescale passive
newer PC, which significantly reduced packet drops. bandwidth monitoring, ICN2007, Sainte-Luce, April 2007.
Reh´ak, L. Baxa, Tbwtools: Processing TCP performanceinformation, ICSPC 2007, Dubai, November 2007.
[8] S. Ubik, A. Friedl, S. Hotmar, Quantification of Traffic Burstiness with
Benko and Veres have proposed a TCP packet loss mea-
MAPI Middleware, CESNET 2008, Prague, September 2008.
[9] Peter Benko, Andreas Veres. A Passive Method for Estimating End-
surement approach based on monitoring sequence numbers
to-End TCP Packet Loss, In Proceedings of IEEE Globecom, 2002,
in TCP packets [9]. Our approach uses a completely differ-
[10] S. Ohta, T. Miyazaki. Passive packet loss monitoring that employs
ent estimation approach, independent from the L4 protocol
the hash-based identification technique, In Ninth IFIP/IEEE Interna-
specification, and thus can be universally applied to both
tional Symposium on Integrated Network Management (IM), 2005.
TCP and UDP connections. Ohta and Miyazaki [10] have
explored a passive monitoring technique for packet loss es-timation relying on hash-based packet identification. Their
Sven Ubik received his MSc. and Dr. in computer sci-
work is similar to our approach, but ours differs in that it
ence from the Czech Technical University. He is currently
matches packets to flows and compares flows with each
with the Research department of CESNET.
other for computing the packet loss.
Aleˇs Friedl is working towards his MSc in computer sci-
ence at the Czech Technical University.
We have developed and deployed distributed passive
monitoring infrastructure in the pan-European GEANT2network. Several novel applications provide useful char-acteristics about network behaviour and traffic treatmentthat could only be obtained from passive monitoring. Wedemonstrated that the architecture can process multiple gi-gabits per second of real traffic with current hardware.
Packetloss results can be distorted if packets are lost in
monitoring stations. Monitoring cards have 100% line-ratethroughput under all conditions. However, software pro-cessing may not catch up with the volume of traffic. If thathappens, the monitoring card driver provides exact infor-mation about the number of packets overwritten in its circu-lar buffer. We monitor these drops by our Servmon serviceapplication. Most of measured drop periods are caused byDiMAPI restarts. This does not affect Packetloss results,because Packetloss starts matching flows between monitor-ing stations after some period following startup. We planto investigate how to elimite other drops in monitoring sta-tions from Packetloss results.
In the proposed GN3 project we envision to extend de-
ployment in steps to all GN3 border links to provide a pan-European service. We also plan to improve the architec-ture particularly to efficiently utilize multi-core CPUs andto provide measured information in novel user interfacesfor easy navigation to the data of interest.
[1] Deliverable MS.3.7.5: Report on Passive Monitoring Pilot, SA3 ac-
Zejdl, Passive monitoring of 10 Gb/s lines with PC hard-ware, TNC2008, Bruges, May 2008.
[3] DAG cards, Endace company, http://www.endace.com. [4] SCAMPI - A Scaleable Monitoring Platform for the Internet, FP5
[5] LOBSTER - Large-scale Monitoring of Broadband Internet Infras-
tructures, FP6 Project, Contract No. 004336.
Ananda K Nanjundaswamy 2051 Kerr Dr R-09 Email: [email protected] Bioprocess development specialist with 8 years of industry experience: • 5 years experience in development and production of agri-based products like biopesticides and insect pheromones, production and purification of glycopeptide antibiotics and secondary metabolites from plant tissue culture • 3 years experien
GAZZETTA UFFICIALE DELLA REPUBBLICA ITALIANA Serie generale - n . 1 prezzo ex factory (I.V.A. esclusa): € 1700,00; prezzo al pubblico (I.V.A. inclusa): € 2805,70; Il presente medicinale è inserito nell’elenco dei farmaci sottoposti a monitoraggio intensivo delle sospette razioni Condizioni: Ai fi ni delle prescrizioni a carico del avverse di cui al decreto del 21 novem

 ABW [6] measures link load in short time intervals (1s).