Inhibitory Effect of Carbon Dioxide on the Fed-Batch Culture of Ralstonia eutropha: Evaluation by CO Pulse Injection and Autogenous CO Methods Longan Shang,1* Min Jiang,1** Chul Hee Ryu,1 Ho Nam Chang,1 Soon Haeng Cho,2 Jong Won Lee3 1Department of Chemical and Biomolecular Engineering, Korea AdvancedInstitute of Science and Technology, 373-1 Guseong-dong, Yuseong-gu,Daejeon 305-701, Korea; telephone: 82-42-869-3912; fax: 82-42-869-3910;e-mail: [email protected]2Separation Process Research Center, Korea Institute of Energy Research,72-1 Jang-dong, Yuseong-gu, Daejeon 305-343, Korea3Department of Biochemistry, School of Medicine, Catholic University ofDaegu, 3056-6, Daemyeong 4-dong, Nam-gu, Daegu, 705-034, KoreaReceived 7 October 2002; accepted 14 January 2003Abstract: In order to see the effect of CO inhibition re-
PHB of 97.2 g/L was obtained, which corresponded to
sulting from the use of pure oxygen, we carried out a
70% of the PHB production at 1.0 vvm O flow rate. This
comparative fed-batch culture study of polyhydroxybu-
new method measures the inhibitory effect of CO pro-
tyric acid (PHB) production by Ralstonia eutropha using
duced autogenously by cells through the entire fermen-
air and pure oxygen in 5-L, 30-L, and 300-L fermentors.
tation process and can avoid the overestimation of CO2
The final PHB concentrations obtained with pure O were
inhibition without introducing artificial CO into the fer-
138.7 g/L in the 5-L fermentor and 131.3 g/L in the 30-L
mentor. 2003 Wiley Periodicals, Inc. Biotechnol Bioeng 83:
fermentor, which increased 2.9 and 6.2 times, respec-
tively, as compared to those obtained with air. In the
Keywords: CO inhibition; PHB synthesis; pure oxygen;
300-L fermentor, the fed-batch culture with air yielded
Ralstonia eutropha; CO pulse; autogenous CO
only 8.4 g/L PHB. However, the maximal CO concentra-
tions in the 5-L fermentor increased significantly from4.1% (air) to 15.0% (pure O ), while it was only 1.6% in
INTRODUCTION
the 30-L fermentor with air, but reached 14.2% in the caseof pure O . We used two different experimental methods
There have been many reports regarding the inhibitory ef-
fects of carbon dioxide on the growth and metabolism of a
autogenous CO methods. A 10 or 22% (v/v) CO pulse
wide range of microorganisms such as bacteria, yeast, and
with a duration of 3 or 6 h was introduced in a pure-oxygen culture of R. eutropha to investigate how CO
filamentous fungi (Dixon and Kell, 1989; Jones and Green-
affects the synthesis of biomass and PHB. CO inhibited
field, 1982; McIntyre and McNeil, 1998). The previous
the cell growth and PHB synthesis significantly. The in-
studies focused on using CO to control the growth of
hibitory effect became stronger with the increase of the
pathogenic organisms or food spoilage organisms and pro-
concentration and pulse duration. The new pro-
tect the quality of food or water (Dixon and Kell, 1989;
place microbial cells under different CO level environ-
McIntyre and McNeil, 1998). Later, it was found that the
ments by varying the gas flow rate. Introduction of O
fermentation progress could be affected by the CO pro-
gas at a low flow rate of 0.42 vvm resulted in an increase
duced by the microorganism itself (Dixon and Kell, 1989;
of CO concentration to 30.2% in the exit gas. The final
McIntyre and McNeil, 1998; Onken and Liefke, 1989). Many studies on the mechanisms were summarized byJones and Greenfield (1982). Among the several molecular
*Current address for Longan Shang: Department of Chemical Engineer-
species of CO in the liquid phase, the CO (aq) and HCO −
ing, Northwest University, Xian 710069, China. E-mail: Lashan@
were generally responsible for the CO inhibition on micro-
**Current address for Min Jiang: College of Pharmacy and Life Science,
organisms (Dixon and Kell, 1989; Jones and Greenfield,
Nanjing University of Technology, Nanjing 210009, China.
1982). However, it is still difficult to find a single primary
mechanism to explain the observed results (McIntyre and
Contract grant sponsor: the Korea Science and Engineering Foundation
Contract grant number: R01-2000-000-00331-1
CO inhibition on cell growth and product formation in
Contract grant sponsor: the Brain Korea21 project of the Ministry of
fermentation has been demonstrated. Two research groups
have reported the effects of dissolved CO in two important
MATERIALS AND METHODS
industrial strains, Penicillium chrysogenum (Edwards andHo, 1988; Ho and Smith, 1986) and Aspergillus nigerMicroorganism and Medium
(McIntyre and McNeil, 1997a,b,c, 1998). Their morpholo-gies, being of importance in the evaluation of cell growth
Ralstonia eutropha (formerly known as Alcaligenes eutro-
and product formation, were apparently affected if the in-
phus) NCIMB 11599 was used throughout this study. The
fluent CO concentration was higher than 5%. Other organ-
seed culture medium composition and the initial medium
isms such as Escherichia coli (Lacoursiere et al., 1986;
composition for fed-batch culture are given in Table I. Thetrace element solution contains per liter: 10 g FeSO
Mori et al., 1983), Clostridium acetobutylicum (Mollah and
(7H O), 2.25 g ZnSO (7H O), 1.2 g CuSO (5H O), 0.5 g
Stuckey, 1992), Pseudomonas sp. (Gill and Tan, 1979; King
and Nagel, 1975), Saccharomyces cerevisiae (Kuriyama et
(7H O), 0.12 g (NH ) Mo O , and 10 ml 35% HCl.
al., 1993), and Zymomonas mobilis (Veeramallu and
Agrawal, 1986) were also sensitive to CO . The reported
effects were dependent on the CO concentration and the
Culture Condition
organism employed in their experiments. In order to avoid
Fed-batch cultures of R. eutropha were carried out in three
the overestimation of CO effects, a pulse or pulses of CO -
different scale fermentors (5, 30, and 300 L). At 30°C the
enriched gas, rather than the continuous CO -enriched gas-
gas flow-rates were maintained at 1.0 vvm based on the
sing of batch cultures from time zero, was used in batch
initial culture volume and pH was maintained at 6.7. Gas
cultures (McIntyre and McNeil, 1997c). The estimated CO2
flow-rates and pressures were monitored and independently
effects would depend on the CO concentration and pulse
controlled with a gas mixer and a mass flow meter. When
lasting time in a given experiment. Therefore, the results
pure oxygen was used as the gas phase, the dissolved oxy-
obtained from continuous or CO pulse technique may not
gen concentration was maintained at higher than 25% of air
be applicable to real fermentation conditions where autog-
saturation by increasing the agitation speed. When air was
enous CO evolution is quite different from the experimen-
used as the gas phase, the dissolved oxygen concentration
was maintained as high as possible by increasing the agita-
A number of studies on the production of poly-
tion speed up to its maximum value. The maximum agita-
hydroxyalkanoates (PHAs) have been carried out (Kim et
tion speeds of 5, 30, and 300 L fermentors were 900, 450,
al., 1994; Lee et al., 2000; Hori et al., 2002; Park et al.,
2001; Rehm and Steinbuchel, 1999; Ryu et al., 1997; Shang
In checking the effects of carbon dioxide on the process
et al., 2003; Van Wegen et al., 2001). Ralstonia eutropha is
of PHB production, a 6-h pulse of CO with 22% (v/v) in
one of the major producers of PHAs since it can grow fast
pure oxygen was introduced into fermentor at a defined cell
and accumulate higher amounts of PHAs than any other
growth stage (lag, exponential, stationary). A 3-h pulse of
microorganisms. The highest productivity (3.75 g PHB/L.h)
CO with 22% (v/v), and another 3-h pulse of CO with
was obtained in the fed-batch culture with the aid of pure
10% (v/v), were employed to examine the effects of CO2concentrations and CO pulse lasting time on the fermen-
oxygen (Ryu et al., 1999). However, the use of oxygen is
tation process of PHB production. The gas mixture of CO
expensive and thus it becomes necessary to maximize the
and pure oxygen was prepared with a gas-mixer (New
use of pure oxygen by reducing the oxygen flow rate. This
would result in a CO concentration in culture media much
In the absence of oxygen limitation, the CO concentra-
higher than with air supply only. This high CO concentra-
tion in the exit gas from a fermentor would increase with the
tion may inhibit the metabolic activities of microbial cells
decrease of the gas flow rate and the microbial cells can be
(Ho and Smith, 1986; McIntyre and McNeil, 1997c).
placed under different CO concentration environments,
In this study we investigated the effects of CO on cell
then the effect of CO produced autogenously by cells can
growth and PHB synthesis in the fed-batch culture of R.
be estimated by changing the gas flow rate. Based on this
eutropha. We applied the CO pulse technique to see how
CO concentration and pulse duration affect PHB synthesis
and cell growth. Our new proposed approach is to vary the
oxygen flow rate so that the autogenous evolution of CO2
from the microbial cells may change the CO concentration
in the culture broth. In this case, the CO concentration will
increase with the decrease of gas flow rate. The results of
this study will shed light on temporal and integral CO2
inhibition patterns on the biosynthesis of PHB and the
growth of R. eutropha. This can give us insight into how to
suppress or promote metabolic activities of various other
SHANG ET AL.: CO INHIBITION ON FED-BATCH CULTURE
idea, a fed-batch culture was carried out at an O flow rate
ducing high-purity oxygen, it would become possible to
of 0.42 vvm to examine the effect of CO produced by R.
achieve a high cell density in large-scale fermentors as well.
But the CO concentration in effluent gas will also increase
in high cell density cultures. As shown in Table II, the ratioof exit CO concentrations in pure oxygen and air was just
Analysis Methods
3.6 in the 5-L fermentor, but it increased to 8.9 in the 30-L
Cell growth was monitored by measuring an optical density
fermentor. In fact, the pure oxygen flow rate would be kept
(OD) at 600 nm with a spectrophotometer (Beckman, Palo
as low as possible to fully utilize O . This would result in a
Alto, CA). Cell concentration was determined by measuring
further increase in the concentration of CO . A highly dis-
the dry cell weight (DCW) of a 2-ml culture broth. The
solved CO concentration is more likely to occur in a large-
broth sample was centrifuged, washed with distilled water,
scale industrial fermentor than in a lab-scale fermentor due
and dried in an oven at 60°C until no further decrease was
shown in weight. PHB concentration was determined with agas chromatograph (Varian 3300, San Fernando, CA) withbenzoic acid as the internal standard (Braunegg et al., 1978;
CO Concentrations in the Effluent Gas and in the Culture Broth
Shang et al., 2003). The residual cell weight (RCW) wasdefined as the cell concentration less PHB concentration.
A linear relationship between the dissolved CO concentra-
Carbon dioxide concentration in the influent and effluent
tion in the culture broth and that in exit gas was found when
gas was measured with a gas analyzer (Model LKM2000-
the operation pressure is steady (McIntyre and McNeil,
03, LOKAS Automation Corp., Korea). Glucose concentra-
1997c). The liquid phase CO concentration can be moni-
tion in the medium was automatically analyzed and con-
tored with a dCO probe. Its performance may be affected
trolled at 9 g/L with a glucose analyzer (Model 2730, Yel-
by the presence of organic acids, but not significantly (Pu-
low Springs Instruments, Youngstown, OH).
har et al., 1980; McIntyre and McNeil, 1997c). Consideringthat CO in the culture broth can exist in various forms, such
RESULTS AND DISCUSSION
and they may affect the metabolic activity of microbial cellsdifferently, we chose to monitor the concentrations of CO2
High Cell Density Culture With Pure Oxygen and
in the influent and effluent gas with a gas analyzer. At the
CO Production
current experimental pH of 6.7 the most dominant forms of
A set of fed-batch cultures of R. eutropha was carried out
with pure oxygen or air, as shown in Table II. When air wasused, the DCW and PHB concentration obtained in the 5-Lfermentor decreased by 54% and 66%, respectively, as com-
CO Inhibition on the Biosynthesis and Cell Growth
pared with those obtained with pure oxygen. In the 30-Lfermentor, the DCW and PHB concentration decreased by73% and 84%, respectively. In the 300-L fermentor, the
Carbon Dioxide Pulses at Different Cell
obtained DCW was just 23.4 g/L due to the oxygen limita-
tion. The supply of pure oxygen can effectively eliminatethe oxygen limitation and achieve a higher cell density.
A series of experiments were designed to estimate the ef-
High cell density culture (HCDC) technologies have at-
fects of CO on the cell growth and PHB formation in
tracted attention, as they may guarantee high product level
fed-batch cultures of R. eutropha. A 6-h pulse of 22% (v/v)
(Babu et al., 2000; Riesenberg and Guthke, 1999). It is
CO in pure oxygen was introduced into fermentor at a
relatively easy to achieve a very high cell density in a small-
defined cell growth stage such as the lag phase, the expo-
scale fermentation for several important industrial microor-
nential phase, or the stationary phase to determine which is
ganisms such as Escherichia coli, yeast, Bacillus, and R.
the most sensitive stage to CO based on cell growth and
eutropha. However, with the decrease in the cost of pro-
PHB formation (Fig. 1a–c). As a reference, a fed-batch
Table II.
Summary of fed-batch cultures with oxygen and air.
BIOTECHNOLOGY AND BIOENGINEERING, VOL. 83, NO. 3, AUGUST 5, 2003
Figure 1.
Time course of OD, DCW, RCW, PHB concentration, and exit CO levels in the fed-batch cultures with a 6-hour CO pulse (22%) at a defined
cell growth stage. a: Stationary stage between 34.5 and 40.5 h. b: Early exponential stage between 11 and 17 h. c: Lag stage between 3 and 9 h. d: Standard culture without CO pulse. OD (᭢), DCW (᭹), RCW (᭡), PHB conc. (), and exit CO conc. (ࡗ).
SHANG ET AL.: CO INHIBITION ON FED-BATCH CULTURE
culture of R. eutropha was done with no CO
Figure 1a shows the time course of OD, DCW, RCW,
PHB, and exit CO concentrations of the fed-batch culture
A 3-h CO pulse was added into the fermentor at exponen-
with a CO pulse introduced in the stationary stage. During
tial phase to see the effect of CO pulse lasting time in
the 6-h CO pulse, the OD and DCW increased only a little
comparison with the 6-h CO pulse (Fig. 2). The early ex-
in the beginning. The CO concentration in the exit gas was
ponential phase was chosen to introduce the CO pulse
about 33% (v/v) during the CO pulse and it maintained at
since a large amount of CO would be produced at this
about 9% (v/v) thereafter. The decrease of OD and DCW
may be attributed to the damage of cells caused by the
During the CO pulse, the CO concentration was about
temporarily elevated CO concentration in the solution
23% (v/v), which is similar to the case of the 6-h CO pulse.
(Dixon and Kell, 1989; Jones and Greenfield, 1982; McIn-
After 25 h, the CO concentration was almost constant at
tyre and McNeil, 1997a, 1998). After the CO pulse, the cell
10% (v/v). The final DCW and PHB concentration reached
metabolic activity did not recover in the following 4 h. As
175 and 117 g/L, respectively; concentrations that are much
a result, the final DCW and PHB concentration amounted to
higher than those obtained in the case of the 6-h CO pulse
176 and 118 g/L, respectively, which are lower than the
(Fig. 1b). This shows that the pulse duration of CO has a
DCW (208 g/L) and PHB concentration (138.7 g/L) ob-
strong effect on cell growth and PHB accumulation. The
longer the pulse duration, the stronger the inhibition of CO2
Figure 1b shows the inhibitory effect of a CO pulse at
on cell growth and production formation was found to be. In
the exponential phase. Although the maximal CO concen-
the culture of A. niger, the CO inhibition on cell growth
tration in the exit gas was just about 23% (v/v), lower than
and critic acid synthesis also increased with the CO pulse
the 33% (v/v) mentioned above (Fig. 1a), the cell growth
and PHB accumulation were severely influenced. During
Another 3-h pulse of 10% (v/v) CO in pure oxygen was
the CO pulse, the DCW and PHB concentration only in-
introduced at the early exponential phase to see the effect of
creased from 6.5–26 g/L and 0.8–2 g/L, respectively, as
CO concentration on the fermentation process (Fig. 3). The
compared with the DCW increase of 7–48 g/L and PHB
CO pulse lasted only for 3 h and the maximal CO con-
change of 0.6–6 g/L in the standard culture. After the CO
centration in the exit gas was about 11% (v/v). Finally, it
pulse ceased, the DCW and PHB concentrations increased
maintained at a constant value of 9% (v/v), and lasted about
continuously for 20.5 h, but did not increase further. The
20 h, which is very similar to the result obtained with the
RCW continued to increase to 69 g/L in 34 h, which was
3-h CO pulse with 22% (v/v) CO in pure oxygen (Fig. 2).
obtained generally in about 22–24 h without a CO pulse.
The final DCW (190 g/L) and PHB concentration (122 g/L)
This means that the average cell growth rate decreased to
were much higher than those obtained in the 3-h 22% (v/v)
CO pulse. From the results shown in Table IV, we can see
The lowest DCW and PHB concentrations were obtained
the CO inhibition in the cultures of P. chrysogenum, Z.
with a CO pulse in the lag stage between 3–9 h (Fig. 1c). mobilis, and S. cerevisiae also increased with the increase of
The final DCW and PHB concentration just reached 138
CO concentration. All these clearly showed that the higher
and 78.8 g/L, respectively. In this case, it took more than 30
the CO concentration, the stronger the inhibitory effect of
h when the RCW reached its maximal value. After the CO
CO on cell growth and production formation was.
pulse ceased, the cell growth and PHB accumulation were
The efficient way to prevent CO inhibition is to lower
still slow. It can be said that the lag stage, in which the
the exit CO concentration from a fermentor by either in-
productivity of PHB is the lowest (Table III), is the stage
creasing the gas flow rate or supplying inert gases into the
most sensitive to the CO pulse with 22% (v/v) CO in the
fermentor. In the former case a waste of pure oxygen is
influent gas stream. A similar result was found in the culture
expected and in the latter case it will result in a low O2
of A. niger (McIntyre and McNeil, 1997c). Table III.
Summary of the experimental results in the fed-batch cultures with CO pulses.
BIOTECHNOLOGY AND BIOENGINEERING, VOL. 83, NO. 3, AUGUST 5, 2003
Figure 1d shows that the maximal CO concentration in
exit gas from a 5-L fermentor was about 15% (v/v) when thegas flow-rate was 1.0 vvm based on the initial liquid vol-ume. In a 30-L fermentor, the maximal CO concentration
in exit gas was 14.2% (v/v) (as shown in Table II). At thegas flow rate of 0.42 vvm the maximal CO concentration
from a 5-L fermentor reached 30.2% (v/v). In a pure oxygensystem, enough oxygen is always present in the liquid mediaand Monod constant or critical oxygen concentration foroxygen is less than 1 mg O /L. It is unlikely that the oxygen
uptake is transport-limited rather than reaction-limited. Inthis case a higher CO concentration will occur at a lower
Autogenous CO on the PHB synthesis and cell growth. 2
In a large-scale industrial fermentor it is likely that the CO2
concentration would be higher than that in a small-scalefermentor because of increased hydrostatic pressure (Onkenand Liefke, 1989). It is very important to choose a suitablemethod to simulate the conditions in a large industrial fer-mentor for the estimation of CO effect on microorganisms.
McIntyre and McNeil (1997c) reported that the previousexperimental method of continuous CO -enriched gassing
of batch cultures from time zero may lead to a systematicoverestimation of CO inhibitory effects on mycelia organ-
isms and proposed a CO pulse method. The results ob-
Figure 2.
Time course of OD, DCW, RCW, PHB concentration, and exit
tained in the CO pulse method clearly show that two pa-
CO levels in the fed-batch culture with a 3-h CO pulse (22%) in the early
rameters, CO concentration and pulse duration, play a key
exponential stage between 10 and 13 h. OD (᭢), DCW (᭹), RCW (᭡),
role in the estimation of CO inhibitory effect. However,
PHB conc. (), and exit CO conc. (ࡗ).
these two parameters are chosen artificially, which may leadto no conclusive reasoning on how the result of a pulse testis related to real experimental conditions. Another problem
Effect of CO Produced Autogenously by Cells
in the CO pulse method is the sudden increase of the CO
General CO production pattern during aerobic fermen-
concentration that could not occur in actual fermentation
2 tation. Microbial cells can release or utilize CO . Both CO
productions in the ethanol fermentation by Saccharomyces
Here we propose a new method to place microbial cells
cerevisiae or Zymomonas mobilis and CO utilization for
under a higher CO concentration just by lowering the gas
PHB synthesis by R. eutropha in the presence of H are prod-
flow rate, without the necessity of introducing CO artifi-
uct-related (Veeramallu and Agrawal, 1986; Ishizaki et al.,
cially. As shown in Figure 4, the maximal CO concentra-
tion reached 30.2% as the gas flow rate was maintained at
2001). If it is respiration-related, one mole of CO is produced
0.42 vvm. The final DCW (168 g/L) and PHB concentration
per mole of organic carbon oxidized. Since R. eutropha is
(97.2 g/L) decreased by 18.8% and 29.9%, respectively, as
aerobic, CO will come from metabolic oxidation of glucose.
compared with the results obtained in the standard culture
CO production per liter of the culture broth depends on
(Fig. 1d). Also, the cell growth rate decreased by 39% when
cell concentration in terms of g/L (X) and its specific meta-
the CO concentration was at its maximal value (30.2%).
These decreases in DCW, PHB concentration, and cell
growth rate were attributed to the inhibitory effect of theCO produced by cells themselves. During the lag phase
less inhibition occurred because of the low CO concentra-
tion, but during the exponential and stationary phases severe
During fermentation with a gas flow rate of 0.42 vvm, it
exponentially. At some point of this logarithmic phase oxy-
was clear that the inhibitory effect of CO was higher than
gen supply from air is not sufficient and thus pure oxygen is
that in the case of a 3-h 22% CO pulse, but lower than that
will increase and reach a maximum at the end
in the case of a 6-h 22% CO pulse. The maximal CO
of this phase. As the fermentation enters the stationary
concentration lasted for 6 h and showed a pattern of cell
phase, microbial product synthesis are induced, Q
growth and CO inhibition. This technique is essentially a
natural combination of pulse and continuous injection tech-
SHANG ET AL.: CO INHIBITION ON FED-BATCH CULTURE
BIOTECHNOLOGY AND BIOENGINEERING, VOL. 83, NO. 3, AUGUST 5, 2003
Figure 3.
Time course of OD, DCW, RCW, PHB concentration and exit
Figure 4.
Time course of OD, DCW, RCW, PHB concentration, and exit
CO levels in the fed-batch culture with a 3-h CO pulse (10%) in the early
CO levels in the fed-batch culture at a gas flow rate of 0.42 vvm without
exponential stage between 10.5 and 13.5 h. OD (᭢), DCW (᭹), RCW (᭡),
a CO pulse introduced. OD (᭢), DCW (᭹), RCW (᭡), PHB conc. (),
PHB conc. (), and exit CO conc. (ࡗ).
niques of variable CO concentrations, while pulse and con-
References
tinuous injections applied constant CO concentrations.
This method provides an effective way to estimate the in-
Babu KR, Swaminthan S, Marten S, Khanna N, Rinas U. 2001. Production
hibitory effect of CO on microorganisms.
of interferon-alpha in high cell density cultures of recombinant Esch-erichia coli and its single step purification from refold inclusion bodyproteins. Appl Microbiol Biotechnol 53:655–660. CONCLUSION
Braunegg G, Sonnleitner B, Lafferty RM. 1978. A rapid gas chromato-
graphic method for the determination of poly--hydroxybutyric acid in
High cell density culture of R. eutropha can be obtained by
microbial biomass. Eur J Appl Microbiol Biotechnol 6:29–37.
supplying pure oxygen. As a consequence, more CO would
Dixon NM, Kell DB. 1989. The inhibition by CO of the growth and
metabolism of microorganisms. J Appl Bacteriol 67:109–136.
be produced with the increase of cell density. This study
Edwards AG, Ho CS. 1988. Effects of carbon dioxide on Penicillum
confirmed the inhibitory effect of CO on cell growth and
chrysogenum: an autoradiographic study. Biotechnol Bioeng 32:1–7.
PHB formation in the culture of R. eutropha, even though it
Gill CO, Tan KH. 1979. Effect of carbon dioxide on growth of Pseudo-
is one of autotrophic microbes and can use CO as the main
monas fluorescens. Appl Environ Microbiol 38:237–240.
carbon source to produce PHB. The inhibitory effect of CO
Ho CS, Smith MD. 1986. Effect of dissolved carbon dioxide on penicillin
fermentations: mycelial growth and penicillin production. Biotechnol
will become stronger with the increase of CO pulse dura-
tion and CO concentration. The lag-phase is the most sen-
Hori K, Marsudi S, Unno H. 2002. Simultaneous production of polyhy-
droxyalkanoates and rhamnolipids by Pseudomonas aeruginosa. Bio-
The marked difference found in the cultures with differ-
ent CO pulse duration and CO concentration indicates the
Ishizaki A, Tanaka K, Taga N. 2001. Microbial production of poly-D-3-
hydroxybutyrate from CO . Appl Microbiol Biotechnol 57:6–12.
necessity of a suitable experimental method for the study of
Jones RP, Greenfield PF. 1982. Effects of carbon dioxide on yeast growth
CO inhibition. We developed a new technique of CO in-
and fermentation. Enzyme Microb Technol 4:210–223.
hibition study on fermentation, “the natural or autogenous
Kim BS, Lee SC, Lee SY, Chang HN, Chang YK, Woo SI. 1994. Produc-
CO method” by varying the pure oxygen supply rate to
tion of poly(3-hydroxybutyric acid) by fed-batch culture of Alcalig-
make it possible to place microbial cells under different
enes eutrophus with glucose concentration control. Biotechnol Bioeng43:892–898.
process CO concentration environments. This method will
King AD Jr, Nagel CW. 1975. Influence of carbon dioxide upon the me-
serve as the estimation tool for CO effect in a real fermen-
tabolism of Pseudomonas aeruginosa. J Food Sci 40:362–366.
Kuriyama H, Mahakarnchanakul W, Matsui S. 1993. The effects of pCO2
SHANG ET AL.: CO INHIBITION ON FED-BATCH CULTURE
on yeast growth and metabolism under continuous fermentation. Bio-
Park SJ, Ahn WS, Green P, Lee SY. 2001. Biosynthesis of poly(3-
hydroxybutyrate-co-3-hydroxyvalerate-co-3-hydroxyhexanoate) by
Lacoursiere A, Thompson BG, Kole MM, Ward D, Gerson DF. 1986.
metabolically engineered Escherichia coli strains. Biotechnol Bioeng
Effects of carbon dioxide concentration on anaerobic fermentations of
Escherichia coli. Appl Microbiol Biotechnol 23:404–406.
Puhar E, Einsele A, Buhler H, Ihgold W. 1980. Steam sterilisable pCO2
Lee SY, Wong HH, Choi J, Lee SH, Lee SC, Han CS. 2000. Production of
electrode. Biotechnol Bioeng 22:2411–2416.
medium-chain-length polyhydroxyalkanoates by high cell density cul-
Rehm BHA, Steinbu¨chel A. 1999. Biochemical and genetic analysis of
tivation of Peudomonas putida under phosphorus limitation. Biotech-
PHA synthases and other proteins required for PHA synthesis. Int J
McIntyre M, McNeil B. 1997a. Dissolved carbon dioxide effects on mor-
Riesenberg D, Guthke R. 1999. High-cell-density cultivation of Microor-
phology, growth and citrate production in Aspergillus niger A60. En-
ganisms. Appl Mcirobiol Biotechnol 51:422–430.
Ryu HW, Hahn SK, Chang YK, Chang HN. 1997. Production of Poly(3-
McIntyre M, McNeil B. 1997b. Effect of carbon dioxide on morphology
hydroxybutyric acid) by high cell density fed-batch culture of Alca-
and product synthesis in chemostat cultures of Aspergillus niger A60. ligenes eutrophus with phosphate limitation. Biotechnol Bioeng 55:
McIntyre M, McNeil B. 1997c. Effects of elevated dissolved CO levels on
Ryu HW, Cho KS, Kim BS, Chang YK, Chang HN, Shim HJ. 1999. Mass
batch and continuous cultures of Aspergillus niger A60. Appl Environ
production of poly(3-hydroxybutyrate) by fed-batch cultures of Ral-stonia eutropha with nitrogen and phosphate limitation. J Microbiol
McIntyre M, McNeil B. 1998. Morphogenetic and biochemical effects of
dissolved carbon dioxide on filamentous fungi in submerged cultiva-tion. Appl Microbiol Biotechnol 50:291–298.
Shang LA, Do JH, Fan DD, Jiang M, Chang HN. 2003. Optimization of
Mollah AH, Stuckey DC. 1992. The influence of H , CO and dilution rate
propionic acid feeding for production of poly(3-hydroxybutyrate-co-
on the continuous fermentation of acetone-butanol. Appl Microbiol
3-hydroxyvalerate) in fed-batch of Ralstonia eutropha. Chin J Chem
Mori H, Kobayashi T, Shimzu S. 1983. Effect of carbon dioxide on growth
Van Wegen RJ, Lee SY, Middelberg A. 2001. Metabolic and kinetic analy-
of microorganisms in fed-batch cultures. J Ferment Technol 61:
sis of poly(3-hydroxybutyrate) production by recombinant Escherichiacoli. Biotechnol Bioeng 74:70–81.
Onken U, Liefke E. 1989. Effects of total and partial pressure (oxygen and
Veeramallu UK, Agrawal P. 1986. The effect of CO ventilation on kinet-
carbon dioxide) on aerobic microbial processes. Adv Biochem Eng
ics and yields of cell-mass and ethanol in batch cultures of Zymomonasmobilis. Biotechnol Lett 8:811–816.
BIOTECHNOLOGY AND BIOENGINEERING, VOL. 83, NO. 3, AUGUST 5, 2003
Key benchmark indices ended with modest losses after swinging wildly either ways during the course of the day's trading session. The Sensex ended lower on the back of fall in shares of metal, realty, power, capital goods, telecom and banking companies, after seeing a recovery of around 285 points from day's low. Markets fell as Investors booked profits in China which fell 7.5% as they wo
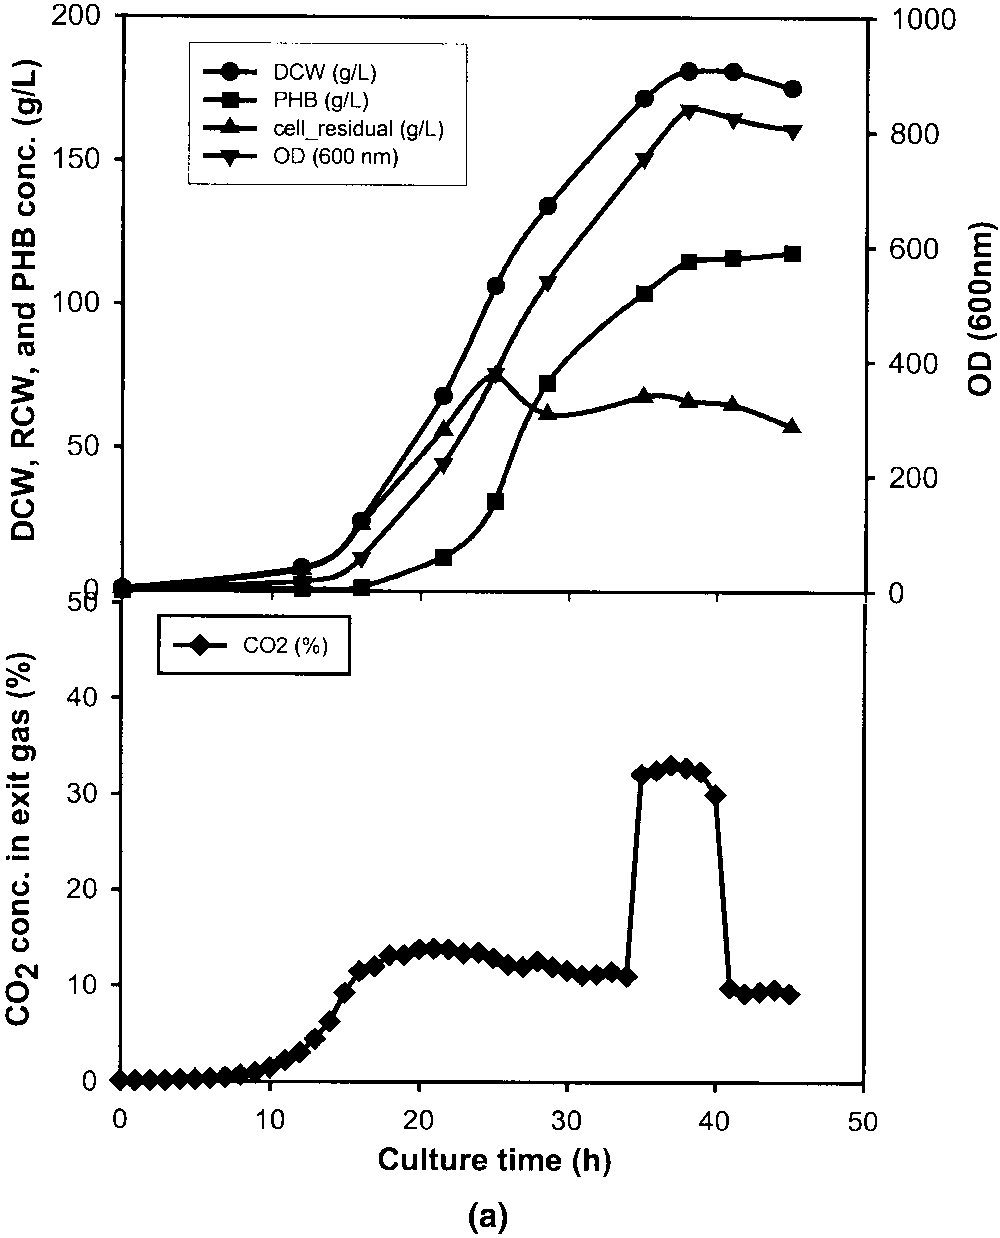
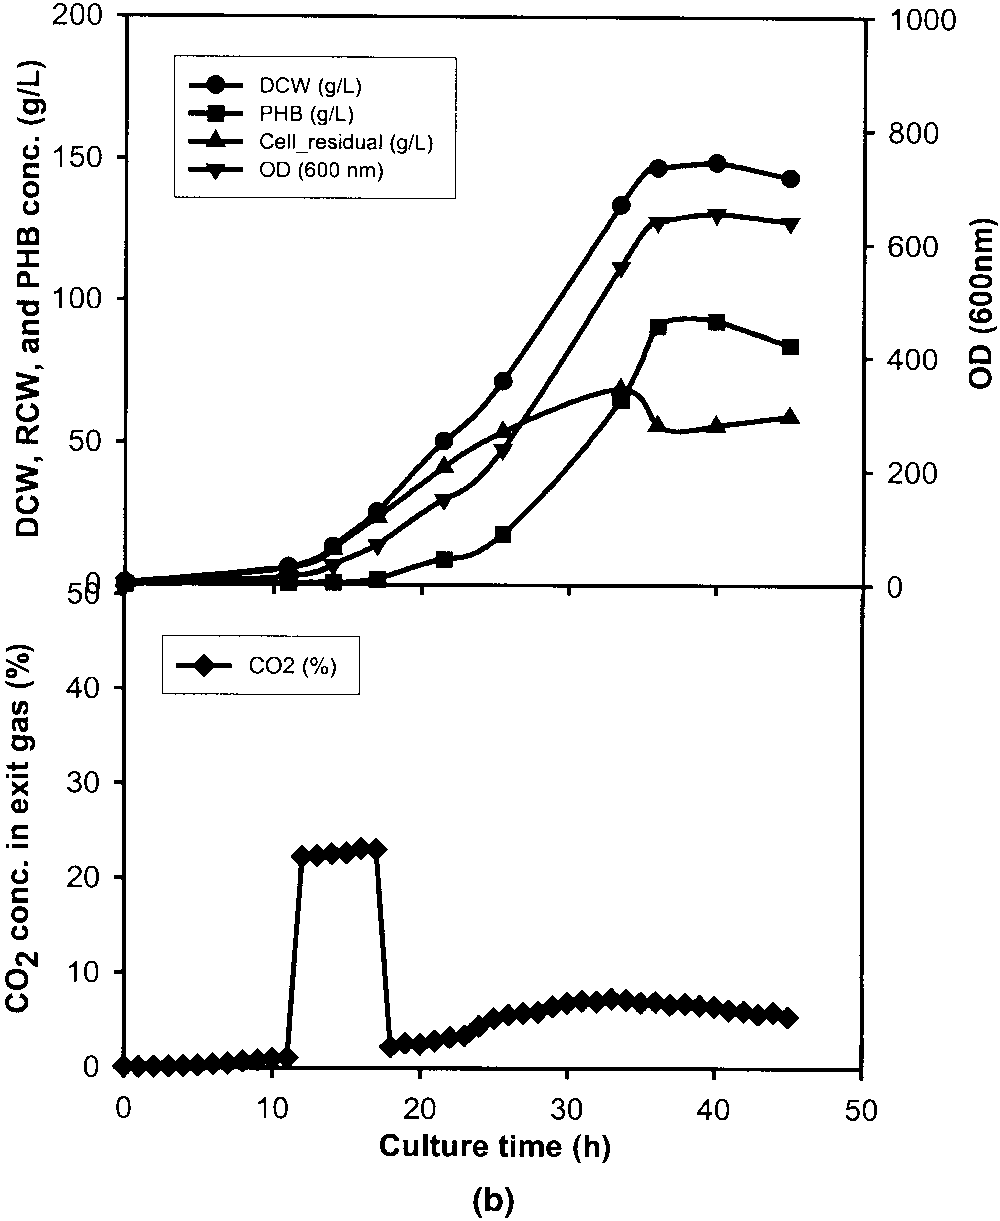
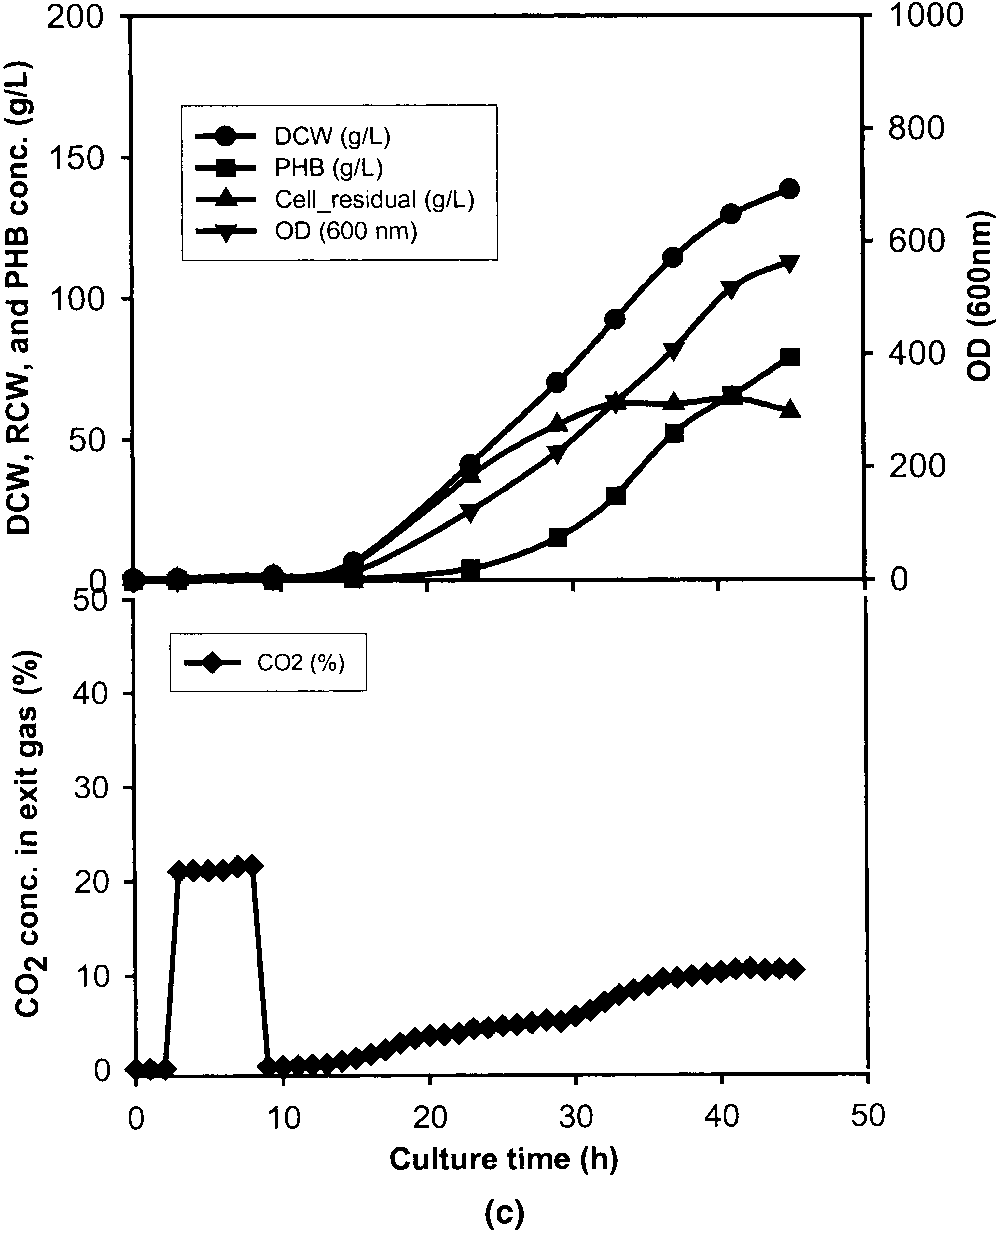
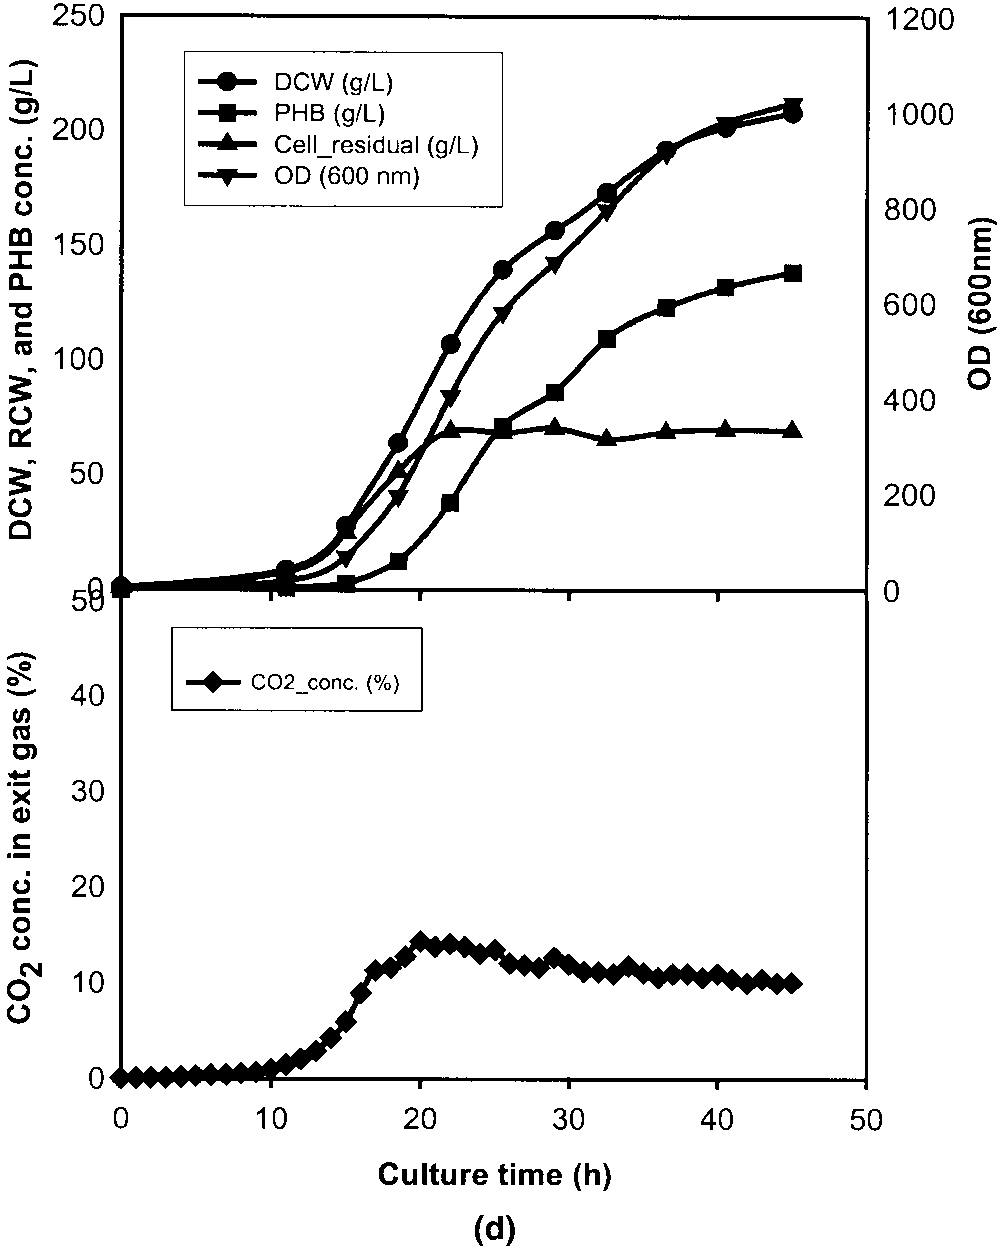 Figure 1.
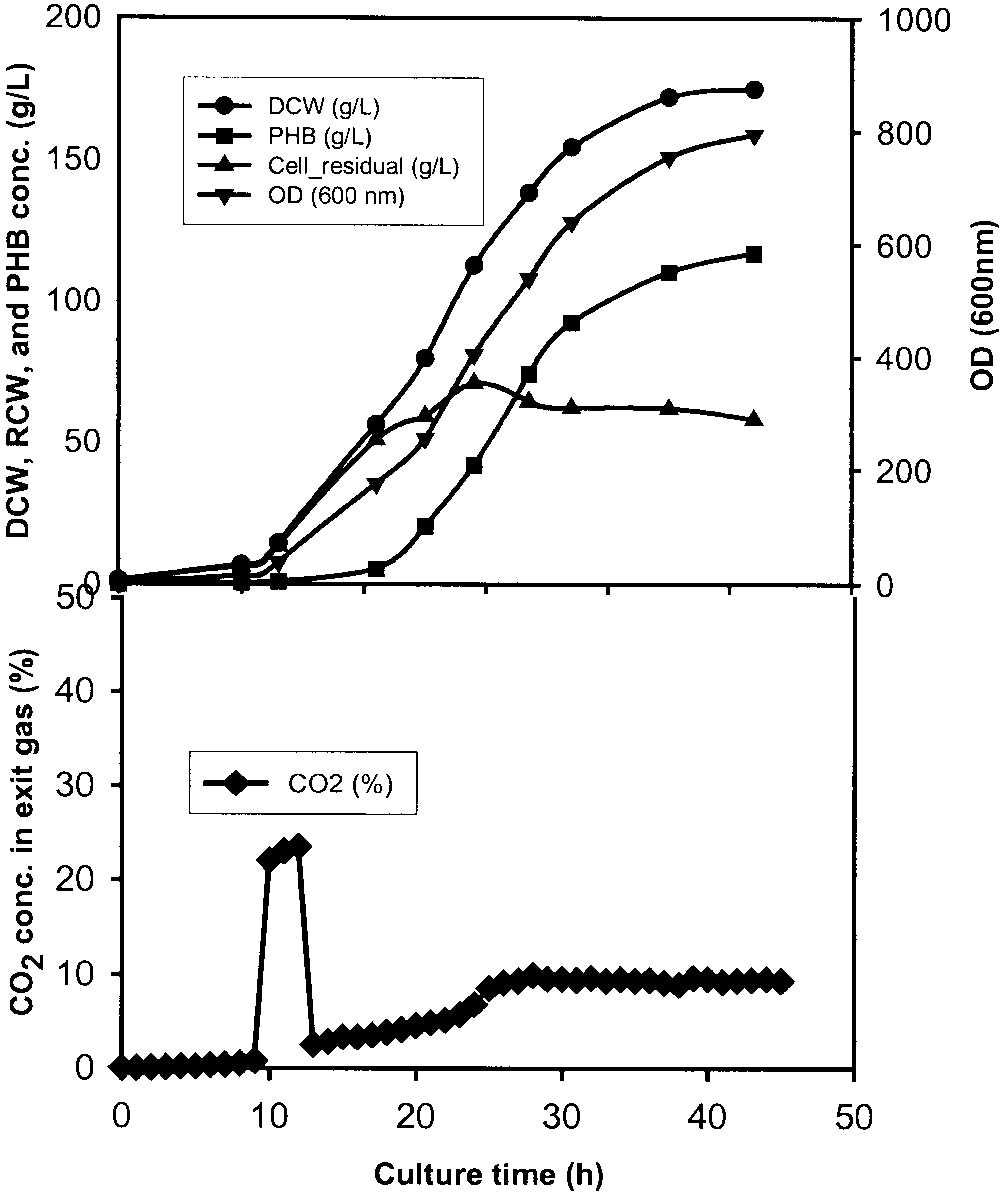 Figure 1d shows that the maximal CO concentration in
exit gas from a 5-L fermentor was about 15% (v/v) when thegas flow-rate was 1.0 vvm based on the initial liquid vol-ume. In a 30-L fermentor, the maximal CO concentration
in exit gas was 14.2% (v/v) (as shown in Table II). At thegas flow rate of 0.42 vvm the maximal CO concentration
from a 5-L fermentor reached 30.2% (v/v). In a pure oxygensystem, enough oxygen is always present in the liquid mediaand Monod constant or critical oxygen concentration foroxygen is less than 1 mg O /L. It is unlikely that the oxygen
uptake is transport-limited rather than reaction-limited. Inthis case a higher CO concentration will occur at a lower
Autogenous CO on the PHB synthesis and cell growth.
Figure 1d shows that the maximal CO concentration in
exit gas from a 5-L fermentor was about 15% (v/v) when thegas flow-rate was 1.0 vvm based on the initial liquid vol-ume. In a 30-L fermentor, the maximal CO concentration
in exit gas was 14.2% (v/v) (as shown in Table II). At thegas flow rate of 0.42 vvm the maximal CO concentration
from a 5-L fermentor reached 30.2% (v/v). In a pure oxygensystem, enough oxygen is always present in the liquid mediaand Monod constant or critical oxygen concentration foroxygen is less than 1 mg O /L. It is unlikely that the oxygen
uptake is transport-limited rather than reaction-limited. Inthis case a higher CO concentration will occur at a lower
Autogenous CO on the PHB synthesis and cell growth.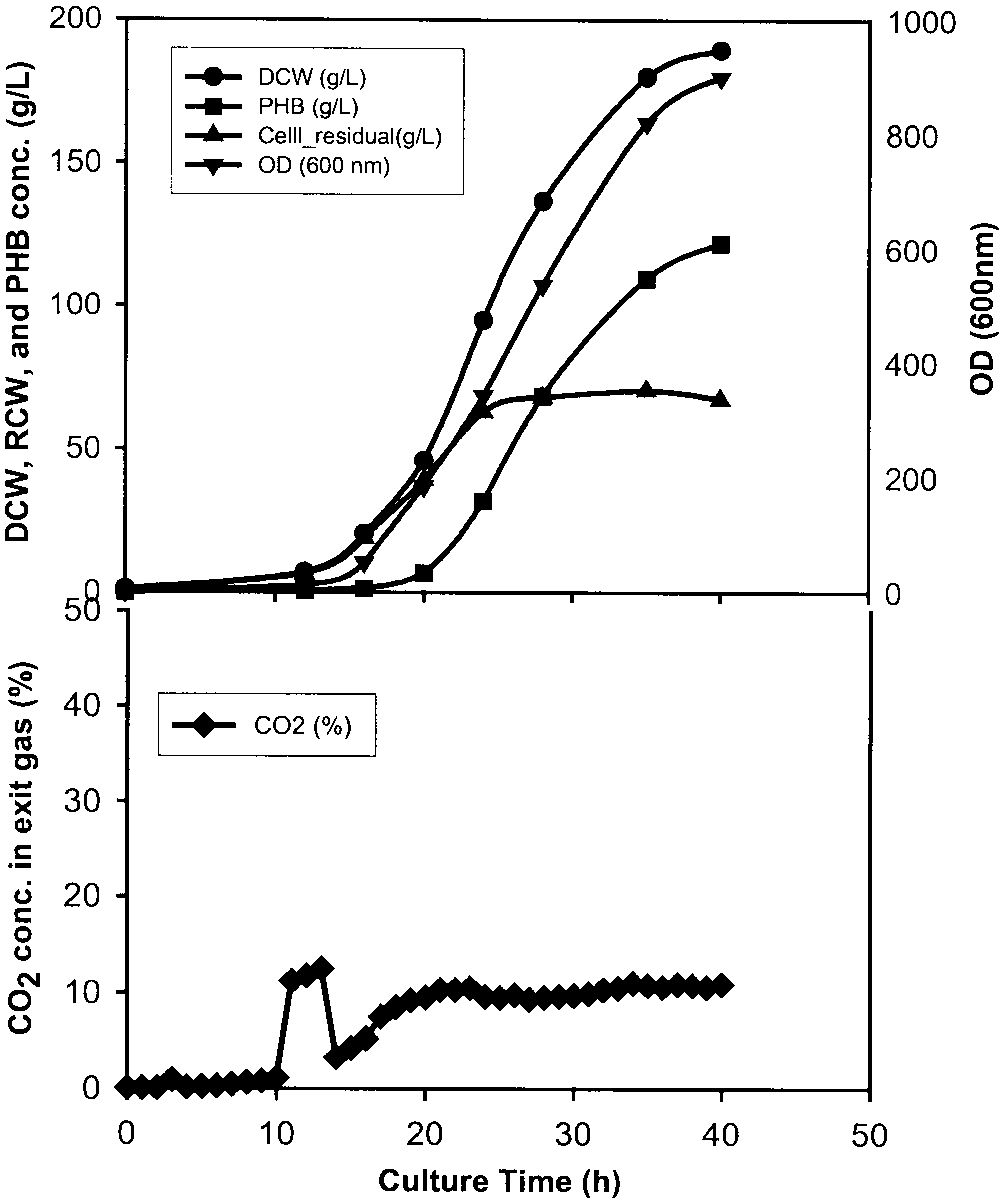
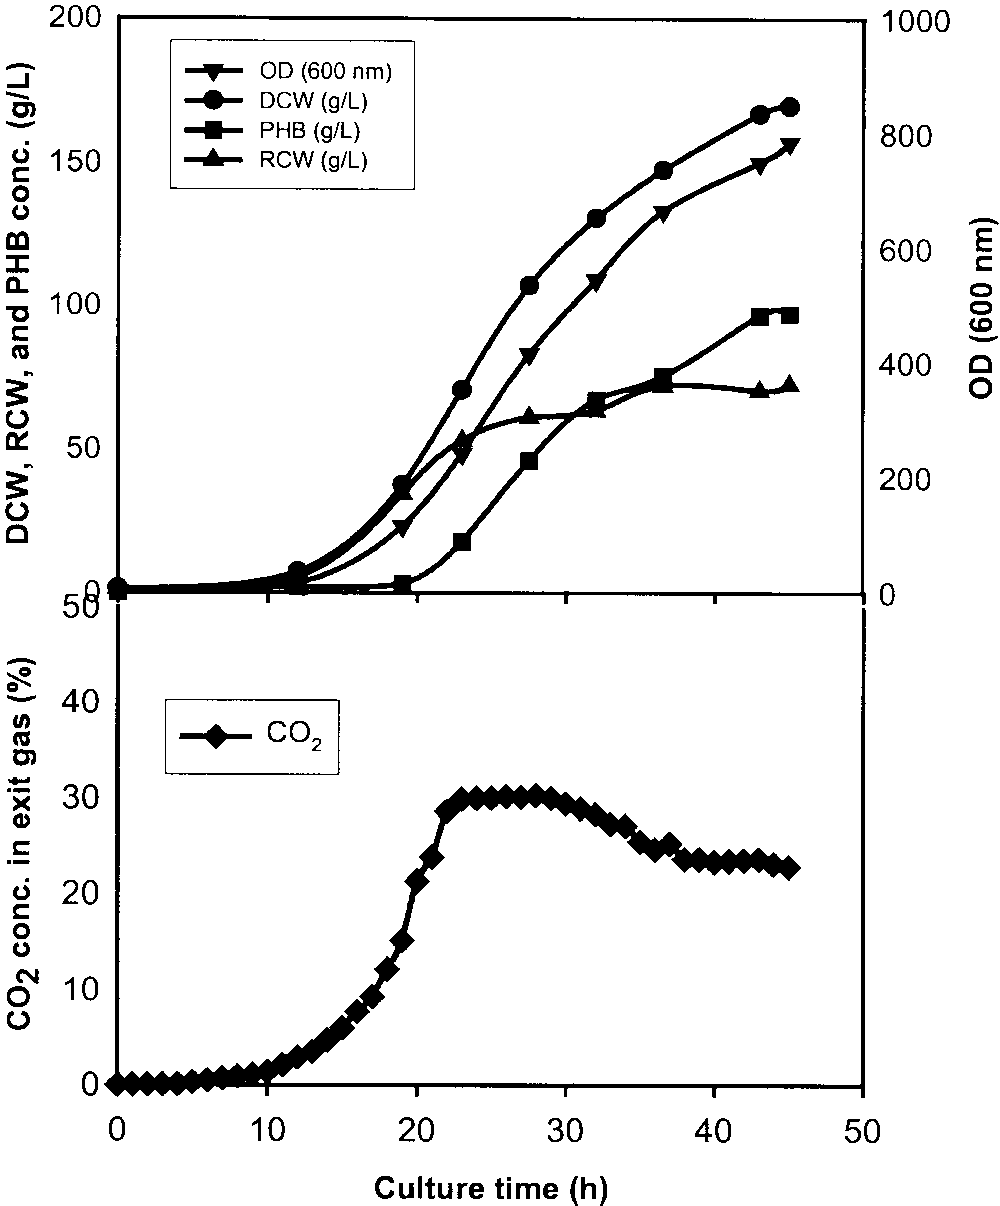 Figure 3.