Optical Interferometers
E N CYC LO PE D IA O F A S T R O N O MY AN D A S T R O PHYS I C S
Optical Interferometers
Optical INTERFEROMETERS are astronomical instrumentsdesigned to provide higher angular resolving power thanis possible with a conventional optical telescope or, inother words, the capacity to measure smaller angles andto discern finer details in an image.
The ability of a telescope to resolve fine detail in
an astronomical object is fundamentally limited by thewavelength (color) of the light used for the observationsand the diameter of the mirror or lens that collects light
imposes a limit on the resolution achievable unless specialtechniques are used, but even above the atmosphere theonly way to see finer detail with a telescope would be toobserve at a shorter wavelength (bluer light) or to build a
The measurement of the sizes of stars was the
challenge that led to the development of optical
Figure 1. The angular diameter of a star θ and the angular
interferometry. The size of a star cannot be measured
separation θs of the components of a binary, or double star.
directly but, if its angular size θ and its distance D canbe determined, its diameter d can be calculated from
d = D × θ , as illustrated in figure 1. From abovethe Earth’s atmosphere the images of all but a very fewstars appear as points of light blurred only by the wavenature of light. From the ground, turbulence in the Earth’s
atmosphere corrupts the light from a star and blurs itsimage so badly that no star, other than our own Sun, canhave its size determined from its image. Astronomers callthis blurring effect ‘SEEING’.
FIZEAU (1868) was the first to propose an interferomet-
ric method to overcome the effects of seeing. He noticedthat when a star was viewed through a small aperture itsimage was blurred but was otherwise regular in shape—unlike that from a large telescope where the image is
blurred but also continually changing. This led him tothe idea of putting a mask with two small holes in frontof a telescope and observing the superimposed images of
the star. The combined image would be crossed by inter-ference fringes—alternate bright and dark bands. Fizeau
Figure 2. Cross section of the Michelson stellar interferometer
realized that the contrast of the fringes, the difference in
mounted on the 100 inch Hooker telescope on Mount Wilson in
brightness of the bright and dark bands, would diminish
as the separation of the apertures was increased, and thatthe fringes would vanish at a separation directly related tothe angular size of the star. Stephan (1873) tested Fizeau’s
Mount Wilson in California was too small to observe
idea but was unable to observe the disappearance of the
the disappearance of the fringes, Michelson had the
fringes since the largest telescope available had an aperture
brilliant idea of attaching a long beam across the front
diameter of only 0.8 m, which was too small. Nevertheless,
of the telescope to carry mirrors to relay starlight from
Fizeau’s idea is the basis of modern optical interferometers
separations greater than the telescope aperture into the
which, by measuring the fringe contrast as a function of
telescope. A diagram of Michelson’s stellar interferometer
the separation of the apertures, are able to determine the
angular sizes of stars and the angular separations of close
In the absence of a turbulent atmosphere even the
binary (double) stars as illustrated in figure 1.
largest optical telescopes, with aperture diameters of 8–
The first measurement of the angular diameter
10 m, would only reveal about a dozen stars as images
of a star was by MICHELSON and PEASE in 1920 when
whose sizes could be measured. While interferometric
they measured the angular diameter of Betelgeuse, the
techniques, like speckle interferometry and developments
bright red supergiant star in the constellation of Orion.
of the masking interferometry originally proposed by
Because even the 100 inch (2.5 m) Hooker telescope on
Fizeau, have enabled telescopes to measure stars to the
Copyright Nature Publishing Group 2001Brunel Road, Houndmills, Basingstoke, Hampshire, RG21 6XS, UK Registered No. 785998and Institute of Physics Publishing 2001Dirac House, Temple Back, Bristol, BS1 6BE, UK
Optical Interferometers
E N CYC LO PE D IA O F A S T R O N O MY AN D A S T R O PHYS I C S
limits set by their aperture diameters and the wavelength
of light, interferometry has moved on to combine the
light from separate apertures in order to increase the
technology in the form of laser metrology, adaptive
optics, fast electronics and computer control and, sincethe driving force was primarily the measurement of stars
and binary stars, most instruments have been calledstellar interferometers.
capabilities of interferometers offer other possibilitiesthat are exciting astronomers and astrophysicists as
the potential of interferometry is recognized.
example, these include the determination of accuratestellar positions (ASTROMETRY), the search for EXOPLANETS(planets other than those in the solar system) and the
Figure 3. The variation of correlation with baseline for two single stars whose angular diameters are shown in the figure.
measurement of the sizes of cores of ACTIVE GALAXIES.
The oscillating curve is the response for a binary star. Theprimary star of the binary has an angular diameter of 1 mas and
Basic theory
is twice as bright as the secondary. The angular separation of the
The minimum angle θmin resolvable by a circular aperture
of diameter d at a wavelength λ is given by
intensity distribution (Iα) of the source can be found.
The fringe phase φ12(0), as a function of the aperture
separation, provides information on asymmetries in the
500 nm. The angular diameters of all but a few stars are
angular intensity distribution—for a symmetrical source
less than a very few milliarcsec (mas) and interferometers
the fringe phase will be zero or 180◦ for all aperture
with aperture separations (baselines) in excess of 10 m are
In practice, the Earth’s turbulent atmosphere disrupts
The combination of the light from two separate
the phase and, for observations made with a single
apertures is similar to a Young’s double-slit experiment
baseline at a time, only the degree of coherence |γ12(0)| is
with interference fringes being formed in the combined
measurable. In the absence of the phase, departures from
images of the source. A measure of the contrast of the
symmetry in the intensity distribution cannot be detected.
fringes is Michelson’s fringe visibility V defined as
Thus, measurements with a single baseline yield only thevisibility, and these are interpreted as the angular size of
an equivalent strip source or the angular diameter of a
radially symmetrical disk source. To obtain images it isnecessary to measure both the modulus and phase for at
where Imax and Imin represent the maximum and minimum
least three baselines simultaneously.
In practice, many interferometers measure the square
A more sophisticated approach involves considera-
of the fringe visibility, which is usually called the
tion of the coherence of the light at the two apertures. Thecomplex degree of coherence γ
terms of a modulus |γ12(τ )| and a phase φ12(τ ), where τ is
the difference in arrival time of the two beams at the point
12(τ ) = [V12(τ )]2 = |γ12(τ )|2.
of combination and the subscripts 1 and 2 represent the
As an example of the variation of correlation with
baseline figure 3 shows the relationships for two stars
with different angular diameters, both assumed to be
12(τ ) = |γ12(τ )| exp[iφ12(τ )].
uniformly bright across their circular disks. Also shown is
When the intensities from the two apertures are equal, the
fringe visibility V12(0) = |γ12(0)|. The complex degree of
If there is a path difference between the beams in an
spatial coherence γ12(0) (i.e. with τ = 0) and the angular
interferometer at the point where they are combined there
distribution of intensity across the source Iα are a Fourier
will be a loss in fringe visibility and in correlation. The
transform pair—the van Cittert–Zernike theorem.
magnitude of the loss depends on the spectral bandwidth
used for the measurements. The wider the bandwidth,
the greater the loss. The reduction in correlation can be
expressed in terms of the coherence length of the light
If |γ12(0)| and φ12(0) are measured over an appropriate
l = λ2/ λ, where λ is the spectral
range of baseline lengths and orientations, the angular
bandwidth and λ is the mean wavelength.
Copyright Nature Publishing Group 2001Brunel Road, Houndmills, Basingstoke, Hampshire, RG21 6XS, UK Registered No. 785998and Institute of Physics Publishing 2001Dirac House, Temple Back, Bristol, BS1 6BE, UK
Optical Interferometers
E N CYC LO PE D IA O F A S T R O N O MY AN D A S T R O PHYS I C S
The Fourier transform of the intensity distribution
across the spectral bandpass is the complex degree ofcoherence and, as an example, the correlation for a flat-topped spectral bandpass is given by
C12( OPL) = [V12( OPL)]2 = sin x
where x = π OPL/ l and OPL is the optical path length
difference between the beams (optical path length is the
product of the geometrical path length in a medium andthe refractive index of the medium).
In order to obtain accurate measurements of fringe
visibility or correlation, the optical paths from the source
to the point of combination of the beams must be equal towithin a small fraction of the coherence length ( OPL
Overcoming the effects of atmospheric turbulence The effect of atmospheric turbulence on incoming light is to distort the shapes of wavefronts and introduce randomly varying phase shifts, wavefront tilts, and Figure 4. A simplified layout for a long-baseline optical
wavefront curvatures. The significance of these effects
interferometer illustrating the main features. A represents the
for interferometry depends on the observing wavelength.
input apertures and T the wavefront tip-tilt correcting mirrors,
The spatial scale of the wavefront distortions is measured
is the difference in path length for the two beams of starlight
at the input apertures, C is the path-equalizing carriage, B is the
beam-combiner and d is the baseline of the interferometer.
a wavefront over which the phase fluctuations have an
Further details are discussed in the text.
rms value of one radian. The temporal scale of the phasefluctuations is represented by t0, the time interval at theend of which the rms value of the phase fluctuations is
at the input apertures and an internal variable optical delay
must be incorporated in the instrument to equalize the
Both r0 and t0 vary as λ6/5 so both improve for longer
optical path lengths at the point of beam combination. One
wavelengths. Observed values depend on the site, and
method of achieving this is shown in figure 4.
both vary from night to night and during the course of eachnight. Typical values for the visual region of the spectrum
For interferometers in which the light from only
two apertures at a time can be combined, only the
In order to overcome the effects of atmospheric
fringe visibility or the correlation is measurable since
turbulence most optical and infrared interferometers use
the phase is disrupted by the atmosphere.
apertures of diameter less than r0 and signal sampling
measurements, made with only a single baseline at a time,
times less than t0. In addition, tilts in the sections of the
the Fourier transform yields the intensity distribution
wavefront accepted by the apertures of an interferometer
for the equivalent strip source (i.e. the source intensity
are individually measured and corrected in real time by
distribution reduced to the equivalent strip source parallel
tip-tilt mirrors (first-order ADAPTIVE OPTICS). This ensures
to the baseline direction). No information on asymmetries
that the beams from the apertures are combined optimally
in the intensity distribution across the source can be
for the measurement of the interference fringe contrast.
derived and true images cannot be constructed.
In principle, instrumental loses and residual seeing
angular diameter determinations and studies of binary
effects are calibrated by observing unresolved stars
systems this is generally of no concern—the relative
between observations of the star or object to be measured.
brightnesses of the components of a binary system can be
Two-aperture interferometers
determined but with a 180◦ ambiguity in the orientation
Modern optical/infrared interferometers operate with
baselines ranging from a few metres up to a few hundred
diameters with complementary measurements made
with conventional telescopes enables fundamental stellar
INTERFEROMETRY: GROUND). This necessitates
mounting the input apertures on separate structures
properties such as surface fluxes, effective temperatures,
anchored to the ground. Because of the short wavelengths
radii and luminosities to be determined. For many binary
involved, extremely good stability and freedom from
stars radial velocities can be determined spectroscopically.
vibration is essential. With the input apertures at fixed
For such systems stellar masses and distances can also be
locations the arrival time of the light from a star will differ
Copyright Nature Publishing Group 2001Brunel Road, Houndmills, Basingstoke, Hampshire, RG21 6XS, UK Registered No. 785998and Institute of Physics Publishing 2001Dirac House, Temple Back, Bristol, BS1 6BE, UK
Optical Interferometers
E N CYC LO PE D IA O F A S T R O N O MY AN D A S T R O PHYS I C S
Table 1. Interferometers and interferometric arrays.
Sydney University Stellar Interferometer (SUSI) Prototype
Interf´erom`etre `a 2 T´elescopes (I2T)
Grand Interf´erom`etre `a 2 T´elescopes (GI2T)
Sydney University Stellar Interferometer (SUSI)
Infrared–Optical Telescope Array (IOTA)
Cambridge Optical Aperture Synthesis Telescope (COAST)
Navy Prototype Optical Interferometer (NPOI) (Astrometry)
Center for High Angular Resolution Astronomy Array
Very Large Telescope Interferometer (VLTI)
† Key: C = program completed and instrument shutdown; W = instrument working; UC = undergoing commissioning orunder construction. Multiple-aperture interferometers
In order to form images with an interferometer it is
either an array of apertures, from which the two to
necessary to use more than two apertures simultaneously.
be used can be selected, or there is the possibility of
For each pair of apertures in an imaging array the same
moving input optics between stations to provide a range of
constraints must be met as for a single-baseline instrument.
baselines. Instruments listed with three or more apertures
This includes matching the optical paths to within a small
are generally intended to combine the light from several,
fraction of the coherence length, dealing with the effects
or all, of the apertures simultaneously for the construction
of wavefront distortion, and using rapid signal sampling
to limit phase smearing during each observational sample
Interferometers and interferometric arrays intended
for astrometric measurements are similar in principle to
Even though the phase measurement for a single
other interferometers and arrays, but differ in having ex-
baseline is corrupted by the atmosphere, it is possible
tensive monitoring of the instrument stability by laser
to determine a ‘closure phase’, free of corruption, for
metrology and an optical delay compensator operatingin vacuum. Astrometric interferometers are of two broad
each independent triangle of baselines formed by three
types—global and narrow-angle (differential). Global as-
apertures of an array. Aclosure phase is solely a function of
trometric interferometers, such as the NPOI Astrometric
the fringe phases due to the source since, in the calculation
Array in Arizona, measure the relative positions of stars
of the closure phase, the atmospherically induced phase
over the whole sky with the aim of maintaining the Hippar-
cos frame and improving proper motion determinations
of the angular intensity distribution across the source
by extending the timebase of measurements. Narrow-
and, together with the fringe visibilities measured for the
angle interferometers are effectively double interferome-
baselines, enable an image of the source to be constructed.
ters with each interferometer linked to the other by preci-
This technique, first developed for radio wavelengths, has
sion laser metrology. One interferometer is phase locked
been adapted to optical and infrared wavelengths.
to a reference source while the second is locked to the tar-
Multiple-aperture interferometric arrays are aimed at
get source to search for relative motion produced by a faint
imaging a range of astronomical phenomena including the
unseen companion such as a brown dwarf or planet.
birth of stars and planetary systems, close binary systems
An alternative interferometric technique for the
and the cores of active galaxies and quasars.
detection of exoplanets is the nulling interferometer. Byworking in the infrared, and suppressing the stellar flux
Modern optical interferometers
by combining the star’s light out of phase, it should be
Table 1 contains a list of optical/infrared interferometers
possible to detect planets down to Earth size but with an
and interferometric arrays with the acronyms by which
they are generally known. The instruments shown as
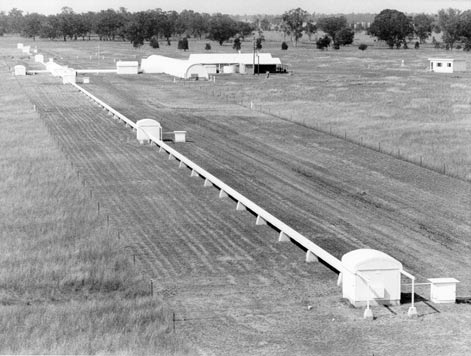
Figure 5 shows an aerial view of SUSI, which is located
having two apertures combine the light from only two
in northern New South Wales in Australia. SUSI has the
Copyright Nature Publishing Group 2001Brunel Road, Houndmills, Basingstoke, Hampshire, RG21 6XS, UK Registered No. 785998and Institute of Physics Publishing 2001Dirac House, Temple Back, Bristol, BS1 6BE, UK
Optical Interferometers
E N CYC LO PE D IA O F A S T R O N O MY AN D A S T R O PHYS I C S
is presented in Science with the VLT Interferometered F Paresce (Berlin: Springer, 1997). Figure 5. The Sydney University Stellar Interferometer (SUSI) seen from the northern end of its 640 m long baseline array.
distinction of having the longest baseline array of anyoptical/infrared interferometer. Since it can only observewith two apertures at a time it does not form images. Instruments such as NPOI, the CHARA Array on MountWilson in California, and COAST in England all havearrays of input apertures arranged along three arms likethe letter Y in order to form images by combining the lightfrom three or more apertures simultaneously. The Keckinterferometer and ESO’s VLTI will combine the light fromseparate 8–10 m class telescopes for imaging of fainterobjects.
Optical and infrared interferometry and interferomet-
ric imaging is in its infancy but promises to make signifi-cant contributions to astrophysical research in the 21st cen-tury.
An overview of optical interferometry and its potential
for astrophysics, as presented at a NATO Advanced StudyInstitute written by authors expert in various aspects of thefield is contained in High Angular Resolution in Astrophysicsed A-M Lagrange, D Mourard and P L´ena (Dordrecht:Kluwer, 1997).
A large proportion of reports on the developments
in optical and infrared interferometry is contained in theproceedings of international symposia and workshops. However, the key technical papers in the developmentof optical interferometry have been collected in SelectedPapers on Long Baseline Stellar Interferometry SPIE MilestoneSeries, Volume MS 139, ed P R Lawson (Bellingham, WA:SPIE, 1997).
The theory of interference with partially coherent
light is treated comprehensively by Born M and Wolf E1975 Principles of Optics:Propagation, Interference, and Diffraction of Light 5th edn(Elmsford, NY: Pergamon).
A review of the scientific potential, particularly for
interferometric arrays involving large aperture telescopes,
Copyright Nature Publishing Group 2001Brunel Road, Houndmills, Basingstoke, Hampshire, RG21 6XS, UK Registered No. 785998and Institute of Physics Publishing 2001Dirac House, Temple Back, Bristol, BS1 6BE, UK
TRANSPLANT MEDICINES E Z E U C W S N E E N I F E D I P I N E J Z R N L I N W Y T R A B N I U T I V P O O L V T J A B D N I A I A A P X U X J J B Z C R S I S E L C M B O P N G C P O X M M N M Z E I T K L J A W Y B A Y N C L R A R V A U G M L A B M F G P V P C U M Y I W A O M T H P C R L M D X L A R U V R L T I X D I R L Y I C A L C W B I L N I D Y Y O O C X I O A O I C D B R E S U Y O C L K P V
GENERAL NUTRITION, WEIGHT LOSS, AND WASTING SYNDROME KEY TO ABBREVIATED TERMS WITHIN GUIDELINES INTRODUCTION RECOMMENDATION: The clinician should ensure that patients with HIV-associated weight loss are receiving effective ARV therapy (see Chapter 4: Guidelines for the Use of Antiretroviral Therapy ) . Significant weight loss negatively impacts a patient’s quality of life and se
 Optical Interferometers