Land Use, Residential Density, and Walking The Multi-Ethnic Study of Atherosclerosis Daniel A. Rodríguez, PhD, Kelly R. Evenson, PhD, Ana V. Diez Roux, MD, PhD, Shannon J. Brines, MS
Background: The neighborhood environment may play a role in encouraging sedentary patterns,
especially for middle-aged and older adults.
The aim of this study was to examine the associations between walking and neighborhood
population density, retail availability, and land-use distribution using data from a cohort of
Data from a multi-ethnic sample of 5529 adult residents of Baltimore MD, Chicago IL,
Forsyth County NC, Los Angeles CA, New York NY, and St. Paul MN enrolled in the
Multi-Ethnic Study of Atherosclerosis in 2000 –2002 were linked to secondary land-use and
population data. Participant reports of access to destinations and stores and objective
measures of the percentage of land area in parcels devoted to retail land uses, the
population divided by land area in parcels, and the mixture of uses for areas within 200 m
of each participant’s residence were examined. Multinomial logistic regression was used to
investigate associations of self-reported and objective neighborhood characteristics with
walking. All analyses were conducted in 2008 and 2009.
After adjustment for individual-level characteristics and neighborhood connectivity, it was
found that higher density, greater land area devoted to retail uses, and self-reported
proximity of destinations and ease of walking to places were each related to walking. In
models including all land-use measures, population density was positively associated with
walking to places and with walking for exercise for more than 90 minutes/week, both
relative to no walking. Availability of retail was associated with walking to places relative to
not walking, and having a more proportional mix of land uses was associated with walking
for exercise for more than 90 minutes/week, while self-reported ease of access to places was
related to higher levels of exercise walking, both relative to not walking.
Conclusions: Residential density and the presence of retail uses are related to various walking behaviors.
Efforts to increase walking may benefit from attention to the intensity and type of land
development. (Am J Prev Med 2009;37(5):397– 404) 2009 American Journal of Preventive Medicine
pendent engagement in community life.2 Despite the
importance of the built environment, there is a paucity
y limiting opportunities for being physically ac-
of studies examining its relationship to physical activity
tive in everyday life, contemporary urban areasare believed to play a role in encouraging sed-
entary patterns and obesity. Relative to young adults,
Proximity to nonresidential land uses, specifically
the role of the neighborhood environment as a barrier
retail uses, has been linked to higher walking rates for
or support of active lifestyles may be more pronounced
utilitarian purposes in the general population.7–12 For
for middle-aged and older adults.1 In addition to
older adults, convenient access to nonresidential desti-
physical activity benefits, for older adults a supportive
nations has yielded inconsistent findings,6 although
neighborhood environment may also encourage inde-
recent studies using objective measures of the builtenvironment have shown more consistent associa-tions.3,13 Only one study3 has examined access to retail
From the Department of City and Regional Planning (Rodriguez),
land uses for older women, and the analysis was limited
and Department of Epidemiology (Evenson), Gillings School of
to department, discount, and hardware stores. Positive
Global Public Health, University of North Carolina, Chapel Hill,
associations were found between accessibility to retail
North Carolina; Department of Epidemiology (Diex Roux), and
School of Natural Resources and Environment (Brines), University of
Beyond the presence of specific land uses, others
Address correspondence and reprint requests to: Daniel A. Ro-
have argued that the proportion of land devoted to
dríguez, PhD, Department of City and Regional Planning, CB 3140
New East, 319, Chapel Hill NC 27599-3140. E-mail: [email protected].
different uses within a given distance from a home
2009 American Journal of Preventive Medicine • Published by Elsevier Inc.
location may also affect levels of physical activity.7,8,14
was developed using extensive qualitative research22 and has
Areas with more proportional mixing of uses may be
been shown to have acceptable test–retest reliability and
supportive of walking because of the availability and
validity among a sample of women.23 For each type of activity
variety of destinations. Further, this diversity may be
queried, participants were asked (1) whether they did the
more important for populations with limited access to
activity during a typical week in the past month and (2) howmany days per week and how many hours and minutes per
automobiles, such as children and older adults.15 Thus,
not only proximity to specific uses such as retail but also
For this study, the focus was on the types of physical
the relative intensity among uses within one’s neighbor-
activities related to walking, which are most likely to be
hood may help explain physical activity levels. For
associated with two key land characteristics: the type of land
example, a neighborhood with 95% of its parcel area
use and the intensity of residential development. The two
devoted to residential uses and 5% to retail has a
walking behaviors examined were minutes per week in walk-
different, less proportionate distribution of area among
ing for transport (e.g., walking to get places such as to the bus,
uses than a neighborhood with 30% of its parcel area
car, work, or store), defined as walking to places; and minutes
devoted to residential uses, 30% to retail, and 40% to
per week walking for leisure (e.g., walking for exercise,
institutional uses. Identifying associations of physical
pleasure, social reasons, during work breaks, walking thedog), defined as walking for exercise. Given unavoidable
activity with specific uses of land, such as retail, and the
measurement error in reports of exact times of walking, the
intensity at which land is developed provides planners
data were categorized rather than investigated as a continu-
with guidance to improve communities and future
ous measure. Categories usually have better reliability than
continuous measures and allow a parsimonious way to man-
Relying on data from a large, multi-ethnic cohort of
age data skewness. As a result, outcome variables were created
adults aged 45 to 84 years, associations between self-
by classifying each type of walking into three levels: no
reported walking and neighborhood population density,
walking, walking time that is less than the median of nonzero
retail access, and land-use distribution, while controlling
data, and walking time greater than or equal to the median
for other environmental and individual characteristics,
are examined. It is hypothesized that greater population
Neighborhood Built Environment Characteristics
density and improved access to retail land uses are relatedto higher levels of walking for various purposes. Respond-
Neighborhood information was collected in part by the MESA
ing to calls for including objectively measured and per-
Neighborhood Study, an ancillary study to MESA, whichincluded the geocoding of each participant’s home address.
ceptual environmental data simultaneously,16–18 the study
All objective measures were derived using ArcGIS 9.2. Neigh-
combines self-reported and objectively measured land-use
borhoods were person specific, defined as the area covered by
information. These analyses contribute to the understand-
a circle of 200-m radius drawn around each person’s home
ing of the role that the mixing of particular land uses can
play in supporting physical activity in middle-aged and
Land-use data were collected from municipal and regional
older adults. Identifying the specific ways in which the
governments in the six study sites. The data were dated
mixing of land uses may affect physical activity has impor-
between 2001 and 2005 depending on the site. An investiga-
tant implications for planning and public health policy.
tor classified the land-use codes of each site into four mutu-ally exclusive categories: retail (including commercial), resi-dential, institutional, and office. For each parcel, whenever a
retail use was present (regardless of other uses present in thebuilding occupying the parcel), the parcel was coded as retail
Study Sample
use. If the parcel had institutional uses (but no retail), it was
The Multi-Ethnic Study of Atherosclerosis (MESA) is a longi-
coded as institutional use. If the parcel had industrial use (but
tudinal study of cardiovascular disease among adults aged
no retail or institutional), the parcel was coded as industrial
45– 84 years at six field sites in the U.S.: Baltimore MD,
use. Land uses in Baltimore County were categorized into
Chicago IL, Forsyth County NC, Los Angeles CA, New York
only commercial and residential uses, as their data lacked the
NY, and St. Paul MN.19 There was no clinically overt cardio-
institutional and office designations. A second investigator
vascular disease at cohort incept. The baseline visit for MESA,
verified the classification and resolved disagreements. Appen-
on which these analyses are based, took place between July
dixes A–F, available online at www.ajpm-online.net, detail the
2000 and September 2002. The study was approved by the
classification of land uses for each site.
IRBs at each site and all participants gave written informed
Availability of retail in each neighborhood was calculated
using the percentage of land area in parcels that containretail uses. By focusing on the area in parcels, transportation
Walking Outcomes
features such as roads and railroads, water bodies, andutilities are excluded from the calculations. One drawback of
A detailed interviewer-administered, semiquantitative ques-
using parcel area is that it penalizes vertical development, for
tionnaire adapted from the Cross-Cultural Activity Participa-
example by treating a parcel with a four-story building in the
tion Study20,21 was used to collect data on all forms of physical
same way as a parcel with a one-story building. Entropy was
activity, including leisure, household, work, and transporta-
calculated using an established formula24 to assess the simi-
tion activities at the baseline examination. The questionnaire
larity in the proportion of the area in parcels devoted to
398 American Journal of Preventive Medicine, Volume 37, Number 5
retail, residential, institutional, and office land uses.7,9,14,24–26
were missing physical activity information, and 11 participants
Entropy values range between 0 and 1, with 1 representing
were excluded because of missing self-reported neighbor-
equal proportion (25%) among the four uses in the neigh-
hood environment data, leaving 5529 participants for
borhood and 0 representing the presence of a single domi-
Multinomial logistic models were used to analyze the
Population density (hundreds of people/hectare) was mea-
three-level categoric outcomes for each of the two outcome
sured using population data from the U.S. Census at the
variables (walking to places and walking for exercise) using
block level and dividing them by the land area in parcels.
Stata 9.2. In all cases, no walking was used as the reference
When a block was not fully contained within a neighborhood,
category. Robust SEs with clustering were used to account for
its population was assigned in direct proportion to the area of
potential correlations among participants within sites.
the block contained within the neighborhood, which assumes
None of the neighborhood objective and self-reported
a uniform population density within each block. Road con-
variables had particularly high colinearity (variance inflation
nectivity was measured as the proportion of the neighbor-hood (the 200-m–radius circle area around each person’s
factor Ͻ4), suggesting that they measure different constructs
home) that is covered by a network buffer. The ratio varies
or they measure similar constructs differently. Therefore, the
between 0 and 1, with 0 meaning that none of the circle area
neighborhood environment variables (objective and self-
can be reached through the road network and 1 meaning that
reported) were first entered one at a time into models that
the entire circle can be reached through the street network,
adjusted for individual characteristics (age, gender, educa-
tion, race/ethnicity, and family income). Models also ad-
Subjective measures of the neighborhood physical environ-
justed for neighborhood road connectivity, because it may be
ment were obtained from a questionnaire administered to
associated with both land use and walking and could there-
MESA participants that included items on ease of walking to
fore confound the association of land use with walking. Next,
places and having stores within walking distance. Responses
all environment variables were entered simultaneously into a
were reported on a 1 to 5 scale in which 1ϭstrongly agree and
single model, adjusting for the same factors. Finally, Stata’s
5ϭstrongly disagree and are treated as continuous. These
lincom command was used to provide a graphic representa-
questions were part of an 11-item index shown to have high
tion of the relationships of interest. All analyses were con-
test–retest reliability (intraclass correlation coefficient [ICC]ϭ
0.88, 95% CIϭ0.79, 0.93).27 The questionnaire also includedtwo questions on the availability of YMCAs/YWCAs andon the availability of free community centers and schools
open to the public, both reported as a binary variable (yes orno). The two variables were merged into a single variable
Descriptive statistics for sociodemographic characteris-
defined as the availability of institutional uses for physical
tics and walking activity of participants are shown in
activity and coded as a binary variable (yes if either is present,
Table 1. Age of study participants ranged between 45
or no if neither is present). These two questions were part of
and 84 years. Just over half of the sample (51.7%) were
an eight-item index with high test–retest reliability (ICCϭ
women; 40.1% of participants were non-Hispanic Cau-
0.85, 95% CIϭ0.75, 0.92).27 Item reliabilities were not re-
casian, 25.9% non-Hispanic blacks, 22.1% Hispanics,
ported. In responding to these neighborhoods’ environment
and 11.9% Chinese. The median time of walking to
items, participants were asked to refer to the area that was
places was 150 minutes/week, and the median time for
approximately a 20-minute or 1-mile walk from their home.
exercise walking was 90 minutes/week. Sociodemographic Measures
Table 2 shows descriptive statistics for the measures
of objective and self-reported land use and residen-
Person-level data on age, gender, race/ethnicity, family in-
tial development intensity. Neighborhoods had an
come, and education were self-reported during the baselineMESA examination. Age was classified into four categories
average population density of 153.2 people per hect-
(45–54, 55– 64, 65–74, and 75– 84 years). Race and ethnicity
are. Forty-one percent of respondents had no retail
were classified as Hispanic, non-Hispanic white, non-Hispanic
land uses in their neighborhood, and only one
black, and Chinese. Family income was grouped into four
quarter of the sample had Ն10.6% of the parcel area
categories (Ͻ$20,000, $20,000 –$39,999, $40,000 –$74,999,
in the neighborhood devoted to retail uses. The
and Ն$75,000). Education was categorized as less than high
entropy measure revealed substantial variability in
school, high school/GED diploma, college, or graduate/
the land-use mixes around the homes of participants.
The percentage of participants agreeing or strongly
Statistical Analysis
agreeing with the statements In my neighborhood it iseasy to walk to places and There are stores within walking
Of the 6061 MESA participants at baseline that lived within
distance of my home were 79.8% and 76.3%, respec-
geographic areas for which land-use data were available, 237
tively. On average, 62.1% of participants reported
were excluded because their address information could notbe connected to the road data set, likely the result of
having schools or community centers with recre-
geocoding error, road data error, or the fact that participants
ational facilities available for free to the public or
lived on very small roads not represented given the scale of
YMCA/YWCAs available within a 20-minute walk
the road data. An additional 284 were excluded because they
Ն150 minute/week, after adjustment. Other land-use
Table 1. Selected individual-level characteristics of
participants included in the analyses, MESA, 2000 –2002
characteristics (availability of institutional uses) were
not related to walking to places. When all the exposures
n
were included in a single model, density remainedpositively associated with walking to places for both
Age (years)
walking levels relative to no walking, and the third and
top quartiles of retail area were positively associated
with more walking. Those with more stores within
walking distance had higher odds of walking to places
Ն150 minute/week, after adjustment. Entropy was not
Race/ethnicity Walking for Exercise Education completed
Table 4 shows adjusted associations for the exercise
walking outcome. When models were estimated for
each exposure separately, density and all self-reported
measures were related to exercise walking for Ͼ90
minutes/week, and ease of walking to places was the
Family income (thousands $)
only variable related to some walking (Ͼ0 and Ͻ90
minutes/week), relative to no walking. For the mea-
sures of land-use mixtures, the third and top quartiles
of retail area and the top quartile of entropy were
OUTCOMES
positively associated with walking Ͼ90 minutes/week. Walking to places (min/wk)
When all the exposures were included in a single
model, density, the top quartile of entropy, and ease of
walking to places remained positively related to exer-
Walking for exercise (min/wk)
cise walking for Ͼ90 minutes/week. Ease of walking to
places remained significantly associated with some
walking (Ͼ0 and Ͻ90 minutes/week).
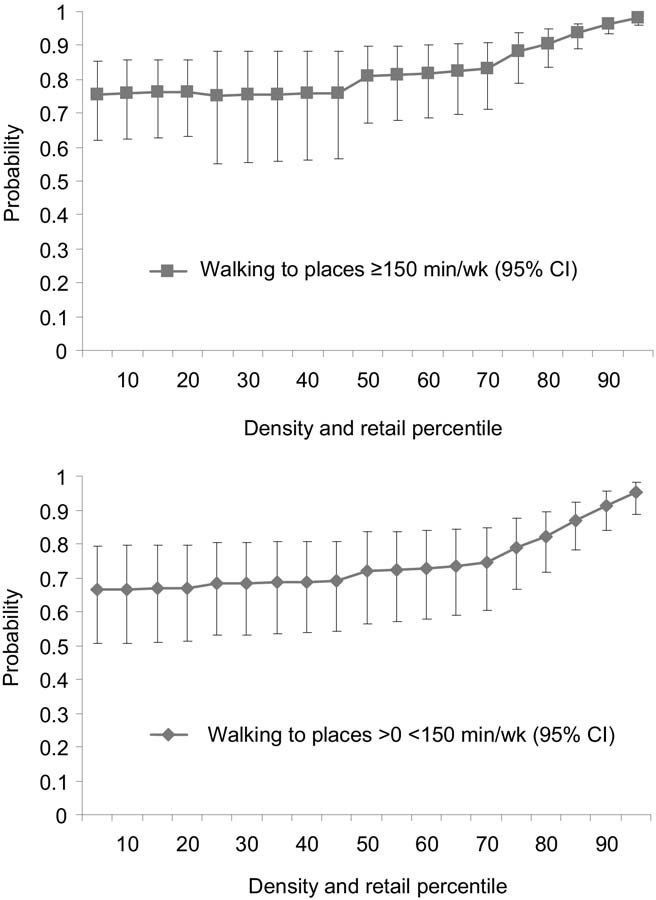
Figure 1 portrays how density and retail uses were
aPercentages do not add to 100 because of rounding.
jointly related to the probability of walking to places
bA measure of colinearity among variables.
based on the parameters estimated, while holding
MESA, Multi-Ethnic Study of Atherosclerosis; NA, not applicable;
constant all continuous variables at their means and allcategoric variables at their modes. The values of densityvary from the 5th to the 95th percentile in the data. The
Walking to Places
values for retail represent the indicator variables in
Adjusted associations of the objective and self-reported
quartiles used in the models. The probability of walking
land-use/intensity variables with walking to places are
to places for Ͻ150 minutes/week relative to no walking
shown in Table 3. When models were estimated for
increased from 75.7% to 98.2% when density and retail
each exposure separately, higher levels of population
increased jointly from the 5th to the 95th percentile.
density and the highest quartile of the percentage of
For similar changes in density and retail, the probability
parcel area devoted to retail were each associated with
of walking for exercise for Ͼ150 minutes/week relative
higher levels of walking to places after adjustment for age,
to no walking increased from 66.4% to 95.2%.
gender, race/ethnicity, education, income, and streetconnectivity. Being in the top quartile (Ն10.6% of par-
cel area in retail) relative to the baseline category ofhaving no retail was associated with 1.81 higher odds of
In a diverse population sample of middle-aged and
some walking (Ͼ0 but Ͻ150 minutes/week) and 2.57
older adults, objective and self-reported measures of
higher odds of walking to places Ն150 minute/week.
land use and residential density were consistently asso-
None of the entropy measures was associated with walking
ciated with higher odds of walking. In adjusted models
examining each measure separately, higher population
For self-reported measures, people reporting that it
density and a higher percentage of parcel area devoted
was easier to walk to places had higher odds of walking
to retail land uses were each associated with higher
to places, and those reporting more stores within
odds of walking to places and walking for exercise.
walking distance had higher odds of walking to places
Weaker evidence was found for self-reported measures
400 American Journal of Preventive Medicine, Volume 37, Number 5
Table 2. Objective and self-reported land-use/intensity characteristics around the home of participants included in analyses, n OBJECTIVE/DERIVED MEASURES (200-m buffer unless noted) Density (hundreds of people/hectare) % parcel area devoted to retail use Entropya
Proportion of 400-m buffer from home accessible via
SELF-REPORTED MEASURES Easy to walk to placesb
3ϭNeutral (neither agree nor disagree)Stores within walking distance (20 min)b
3ϭNeutral (neither agree nor disagree)Availability of institutional uses (schools, YMCA/ YWCAs) within walking distance (20 min)
aEntropy was calculated among residential, institutional, retail, and office uses using the formula presented by Cervero and Kockelman.24 For
parcels with mixed uses, if they contained any retail uses they were considered retail use. Those having any office uses (but no retail) were
considered office uses. Any institutional uses (but no retail or office uses) were considered institutional uses. Higher values represent a more even
proportion of area devoted to each land use.
bMeasured with a Likert-type scale ranging between 1 and 5, with 1ϭstrongly agree and 5ϭstrongly disagree. Scale shown in table and used in analyses
is reversed so that higher values mean more support for walking, consistent with the objective measures.
MESA, Multi-Ethnic Study of Atherosclerosis
of ease of walking, presence of stores, and availability of
to older-age adults. Although measures of neighbor-
hood perceptions were limited, the results suggest that
In models that included both objective and self-
objective features of neighborhoods may influence
reported measures, higher population density and
residents’ behaviors independently of their percep-
higher percentage of parcel area devoted to retail uses
tions. Interestingly, perceived presence of stores within
remained significantly associated with higher odds of
walking distance remained significant for the highest
walking to places. The estimates for the percentage of
level of walking to places even when objective measures
parcel area in retail uses suggest a dose–response
relationship between exposure to retail uses and walk-
Density was the measure most consistently related to
ing to places. In addition, higher density, being in the
walking. Few studies have included as much variation in
top quartile denoting the most proportional distribu-
density as the present study, and fewer have focused on
tion of land among various uses, and self-reported ease
middle-aged and older adults. The strength of density
of walking to places remained associated with walking
in predicting walking activity has been previously no-
for exercise after adjustment for other objective and
ted,9,28,30–32 but studies of older adults remain rare.
The results suggest that the importance of density for
By focusing on land use and residential density in six
physical activity promotion goes beyond the connectiv-
diverse urbanized areas in the U.S., this study extends
ity and access to destinations that density brings.
prior evidence9,14,28,29 regarding the importance of
Figure 1, showing the joint contribution of density
land use and residential density for walking in middle-
and retail to explaining the probability of walking to
Table 3. Adjusted OR (95% CI) of walking to places (in three levels) associated with neighborhood land-use and density
variables, MESA, 2000 –2002 (nϭ5529)
Models for each exposure separatelya,b Full model with all exposures includeda,b Level 2 vs Level 1 Level 3 vs Level 1 Level 2 vs Level 1 Level 3 vs Level 1 OR (95% CI) OR (95% CI) OR (95% CI) OR (95% CI) OBJECTIVE/DERIVED MEASURES Density (hundreds of people/hectare) 1.31 (1.14, 1.51) 1.41 (1.21, 1.65) 1.28 (1.12, 1.46) 1.34 (1.16, 1.55) % parcel area devoted to retail use 1.19 (1.02, 1.38) 1.22 (1.02, 1.46) 1.81 (1.12, 2.93) 2.57 (1.28, 5.15) 1.44 (1.19, 1.76) 1.73 (1.26, 2.38) SELF-REPORTED/PERCEIVED MEASURES 1.13 (1.03, 1.24) 1.26 (1.06, 1.50) 1.29 (1.07, 1.55) 1.09 (1.01, 1.18)
aWalking to places measure categorized into level 1 (none); level 2 (Ͼ0 and Ͻ150 min/wk); and level 3 (Ն150 min/wk)
bAdjustment factors are age, gender, education, race/ethnicity, family income, and proportion of 400-m buffer from home accessible via roads.
Robust SEs with clustering on each site are shown. All objective measures are calculated for a 200-m radius around each participant’s home.
Bolded coefficients are significant at a 95% level of confidence.
MESA, Multi-Ethnic Study of Atherosclerosis
places, has two salient characteristics: nonlinearity and
even when density and retail use are already at consid-
high uncertainty. First, the figure graphically depicts
erable levels, as they move toward the higher percen-
that the benefits of walking, owing to increased density
tiles of their respective distributions. Second, the CIs
and the inclusion of retail land uses, can materialize
suggest that even though the probability of walking to
Table 4. Adjusted OR (95% CI) of walking for exercise (in three levels) associated with neighborhood land-use and density
variables, MESA, 2000 –2002 (nϭ5529)
Single model with all exposures Models for each exposure separatelya,b includeda,b Level 2 vs Level 1 Level 3 vs Level 1 Level 2 vs Level 1 Level 3 vs Level 1 OR (95% CI) OR (95% CI) OR (95% CI) OR (95% CI) OBJECTIVE/DERIVED MEASURES Density (hundreds of people/hectare) 1.09 (1.08, 1.11) 1.06 (1.04, 1.09) % parcel area devoted to retail use 1.34 (1.07, 1.69) 1.49 (1.06, 2.10) 1.29 (1.08, 1.54) 1.19 (1.05, 1.34) SELF-REPORTED/PERCEIVED MEASURES 1.12 (1.07, 1.18) 1.30 (1.20, 1.41) 1.14 (1.08, 1.20) 1.23 (1.14, 1.32) 1.18 (1.07, 1.29) 1.18 (1.05, 1.32)
aWalking for exercise or leisure measure categorized into level 1 (none); level 2 (Ͼ0 and Ͻ90 min/wk); and level 3 (Ն90 min/wk)
bAdjustment factors are age, gender, education, race/ethnicity, family income, and proportion of 400-m buffer from home accessible via roads.
Robust SEs with clustering on each site are shown. All objective measures are calculated for a 200-m radius around each participant’s home.
Bolded coefficients are significant at a 95% level of confidence.
MESA, Multi-Ethnic Study of Atherosclerosis
402 American Journal of Preventive Medicine, Volume 37, Number 5
hold is surrounded by walkable nonresidential destina-tions yields a disproportionate distribution of land usesin an environment supportive of walking to places. Theevidence provided here, in addition to theoretic limi-tations, and the difficulty in correctly interpreting andcommunicating its meaning, suggests that cautionshould be used in applying entropy as a neighborhoodenvironmental measure in future studies.
Compared to other studies, the neighborhood-area
definition of a 200-m circle is small. Measures drawnfrom circles of 400-m and 800-m radii were tested byexamining model fit using the Bayesian informationcriterion (BIC). It has been suggested33 that evidencefavoring one model over another is weak, positive,strong, or very strong if the absolute difference in BICfor two models is 0 –2, 2– 6, 6 –10, or Ͼ10, respectively. With the exception of the single model with all expo-sures explaining exercise walking that exhibited weakevidence favoring the 400-m buffer, all models withexposures measured for the 200-m circle were stronglyor very strongly favored over larger circles. In contrast,another study13 found no pattern in model fit at variousbuffer sizes.
One explanation for the results favoring the smallest
circle is that for an older population, proximal landuses may be more relevant than uses that are moredistant. Another explanation is that the retail andentropy measures are neighborhood-scale dependent,
Figure 1. Adjusted predicted probability and 95% CI of
a phenomenon known as the modifiable areal unit
walking to places relative to no walking by percentile of
problem.34 As the neighborhood area definition in-
neighborhood density and percentage land area devoted to
creases, neighborhood heterogeneity increases, thereby
retail uses, Multi-Ethnic Study of Atherosclerosis (MESA),
decreasing variation in the entropy and retail measures. Note: Walking to places measure categorized into Level 1
Limitations of this study include the use of self-
(none); Level 2 (Ͼ0 and Ͻ150 min/wk); and Level 3 (Ն150
reported walking, the reliance on land-use information
min/wk). Level 1 is the reference category. Adjustment
collected from diverse sources, and potential residual
factors are age, gender, education, race/ethnicity, family
confounding. Bias caused by the cross-sectional design
income, and proportion of 400-m buffer from home accessi-
is also a possibility, because people who enjoy walking
ble via roads. Robust SEs with clustering on each site are
are more likely to move to areas that support walking. Mis-specification of the relevant geographic area couldalso have affected the results.
places increases when density and retail increase jointlyfrom their 10th percentile to their 80th percentile, the
uncertainty around the estimates is such that the pre-dicted change in walking to places is no different from
Taken together, the results of this study provide sup-
port for the relationship of retail, land-use mix, and
Results for the entropy variable were not entirely
residential density with walking behaviors. The findings
consistent. The highest quartile of entropy was associ-
support calls for policies that guide new development
ated with walking for exercise in models adjusted for
and changes in already-developed areas to intensify
individual-level characteristics. However, entropy was
density and mixed land uses. Further, these policies may
not associated with walking to places. This contrasts
be more effective in areas with established levels of
with other studies9,29 and may be the result of measure-
development density and retail land uses, rather than in
ment differences. Although mean entropy in this study
areas with very low density and residential-only land uses.
is almost identical to values in other studies,9,24 the
Prospective studies and evaluation of natural experiments
figures cannot be compared directly. Further, the the-
can further inform this discussion. The relationships of
oretic reasons to expect similarity in the proportion of
neighborhood characteristics with walking underscore
land devoted to different uses to be related to walking
calls for collaborative efforts among traffic engineers, city
are unclear. An instance in which a residential house-
planners, and health professionals to understand how
urban areas can be improved to address the welfare of
14. Frank LD, Andresen MA, Schmid TL. Obesity relationships with commu-
nity design, physical activity, and time spent in cars. Am J Prev Med2004;27(2):87–96.
15. Li F, Harmer PA, Cardinal BJ, et al. Built environment, adiposity, and
This study was funded by a grant from the Robert Wood
physical activity in adults aged 50 –75. Am J Prev Med 2008;35(1):38 – 46.
Johnson Foundation Active Living Research Program. Partial
16. Duncan MJ, Spence JC, Mummery WK. Perceived environment and phys-
funding was also provided by R01 HL071759 from NIH
ical activity: a meta-analysis of selected environmental characteristics. Int JBehav Nutr Phys Act 2005;2:9.
NHLBI (National Heart, Lung, and Blood Institute). The
17. McCormack G, Giles-Corti B, Lange A, Smith T, Martin K, Pikora T. An
MESA Study was supported by contracts N01-HC-95159
update of recent evidence of the relationship between objective and
through N01-HC-95165 and N01-HC-95169 from the NIH
self-report measures of the physical environment and physical activity
NHLBI. The content is solely the responsibility of the authors
behaviours. J Sci Med Sport 2004;7(1S):81–92.
and does not necessarily represent the official views of the
18. McGinn AP, Evenson KR, Herring AH, Huston SL, Rodriguez DA. Explor-
ing associations between physical activity and perceived and objective
NIH. The authors thank the other investigators, staff, and
measures of the built environment. J Urban Health 2007;84(2):162– 84.
participants of the MESA Study for their valuable contribu-
19. Bild DE, Bluemke DA, Burke GL, et al. Multi-ethnic study of atherosclero-
tions. A full list of participating MESA investigators and
sis: objectives and design. Am J Epidemiol 2002;156(9):871– 81.
institutions can be found at www.mesa-nhlbi.org. Lastly, we
20. Ainsworth BE, Irwin ML, Addy CL, Whitt MC, Stolarczyk LM. Moderate
appreciate the spatial assistance of Melissa Smiley and data
physical activity patterns of minority women: the Cross-Cultural ActivityParticipation Study. J Womens Health Gend Based Med 1999;8(6):805–13.
21. LaMonte MJ, Durstine JL, Addy CL, Irwin ML, Ainsworth BE. Physical
No financial disclosures were reported by the authors of
activity, physical fitness, and Framingham 10-year risk score: the cross-
cultural activity participation study. J Cardiopulm Rehabil 2001;21(2):63–70.
22. Henderson KA, Ainsworth BE. A synthesis of perceptions about physical
activity among older African American and American Indian women. Am J
1. Chodzko-Zajko W, Sheppard L, Senior J, Park CH, Mockenhaupt R,
23. Ainsworth BE, LaMonte M, Drowatzky K. Evaluation of the CAPS typical
Bazzarre T. The national blueprint for promoting physical activity in the
week physical activity survey (TWPAS) among minority women. In: Com-
mid-life and older adult population. Quest 2005;57(1):2–11.
munity Prevention Research in Women’s Health Conference. Bethesda
2. Kochera A, Straight A. Beyond 50.05. Washington DC: American Associa-
24. Cervero R, Kockelman K. Travel demand and the 3Ds: density, diversity and
3. King WC, Belle SH, Brach JS, Simkin-Silverman LR, Soska T, Kriska AM.
design. Transport Res Pt D 1997;2(3):199 –219.
Objective measures of neighborhood environment and physical activity in
25. Cervero R. America’s suburban centers: the land use-transportation link.
older women. Am J Prev Med 2005;28(5):461–9.
4. King A, Castro C, Wilcox S, Eyler A, Sallis J, Brownson R. Personal and
26. Frank LD, Pivo G. Relationships between land use and travel behavior in
environmental factors associated with physical inactivity among different
the Puget Sound region. Seattle WA: Washington State Transportation
racial/ethnic groups of US middle- and older-aged women. Health Psychol
27. Echeverria SE, Diez-Roux AV, Link BG. Reliability of self-reported neigh-
5. Wilcox S, Castro C, King AC, Houseman RA, Brownson R. Determinants of
borhood characteristics. J Urban Health 2004;81(4):682–701.
leisure time physical activity in rural compared with urban older and
28. Moudon AV, Lee C, Cheadle AD, et al. Attributes of environments
ethnically diverse women in the United States. J Epidemiol Commun
supporting walking. Am J Health Promot 2007;21(5):448 –59.
29. Rundle A, Roux AV, Free LM, Miller D, Neckerman KM, Weiss CC. The
6. Cunningham GO, Michael YL. Concepts guiding the study of the impact of
urban built environment and obesity in New York City: a multilevel analysis.
the built environment on physical activity for older adults: a review of the
Am J Health Promot 2007;21(4S):326 –34.
literature. Am J Health Promot 2004;18(6):435– 43.
30. de Vries SI, Bakker I, van Mechelen W, Hopman-Rock M. Determinants of
7. Cerin E, Leslie E, du Toit L, Owen N, Frank LD. Destinations that matter:
activity-friendly neighborhoods for children: results from the SPACE study.
associations with walking for transport. Health Place 2007;13(3):713–24.
Am J Health Promot 2007;21(4):312– 6.
8. Frank LD, Sallis JF, Conway TL, Chapman JE, Saelens BE, Bachman W.
31. Lee C, Moudon AV. The 3Ds ϩ R: quantifying land use and urban form
Many pathways from land use to health—associations between neighbor-
correlates of walking. Transport Res Pt D 2006;11(3):204 –15.
hood walkability and active transportation, body mass index, and air
32. Rodriguez DA, Brown AR, Torped PJ. Portable global positioning units to
quality. J Am Plann Assoc 2006;72(1):75– 87.
complement accelerometry-based physical activity monitors. Med Sci
9. Frank LD, Schmid TL, Sallis JF, Chapman J, Saelens BE. Linking objectively
Sports Exerc 2005;37(11):S572– 81.
measured physical activity with objectively measured urban form: findings
33. Raftery AE. Bayesian model selection in social research. In: Marsden PV,
from SMARTRAQ. Am J Prev Med 2005;28(2 S2):117–25.
ed. Sociological methodology. Oxford UK: Blackwell Publishers, 1995:xxvii.
10. Giles-Corti B, Broomhall MH, Knuiman M, et al. Increasing walking— how
34. Cressie N. Change of support and the modifiable areal unit problem.
important is distance to, attractiveness, and size of public open space? Am J
11. McCormack GR, Giles-Corti B, Bulsara M. The relationship between
destination proximity, destination mix and physical activity behaviors. PrevMed 2008;46(1):33– 40.
12. Saelens B, Handy S. Built environment correlates of walking: a review. Med
Sci Sports Exerc 2008;40:S550 – 66.
13. Berke EM, Koepsell TD, Moudon AV, Hoskins RE, Larson EB. Association
of the built environment with physical activity and obesity in older persons.
Supplementary data associated with this article can be found,
Am J Public Health 2007;97(3):486 –92.
in the online version, at 10.1016/j.amepre.2009.07.008.
404 American Journal of Preventive Medicine, Volume 37, Number 5
Faculty Benefits Committee (FBC) Annual Report for 2003 – 2004 Major Issues Major issues addressed during the year included: finalizing the benefits comparison report, long term care insurance, partner benefits, sabbatical leave policy, disability insurance for non-administrative academic faculty with more than a nine month academic year appointment, long term health care cost trend
Volume 21, Number 4, 2011ª Mary Ann Liebert, Inc. DOI: 10.1089/thy.2010.0403Radiation Safety in the Treatment of Patientswith Thyroid Diseases by Radioiodine 131I: PracticeRecommendations of the American Thyroid AssociationThe American Thyroid Association Taskforce on Radioiodine SafetyJames C. Sisson,1 John Freitas,2 Iain Ross McDougall,3 Lawrence T. Dauer,4 James R. Hurley,5James D. Brier
 hold is surrounded by walkable nonresidential destina-tions yields a disproportionate distribution of land usesin an environment supportive of walking to places. Theevidence provided here, in addition to theoretic limi-tations, and the difficulty in correctly interpreting andcommunicating its meaning, suggests that cautionshould be used in applying entropy as a neighborhoodenvironmental measure in future studies.