CLINICAL STUDIES Clinical Utility of Monitoring Tacrolimus Blood Concentrations in Liver Transplant Patients Raman Venkataramanan, PhD, Leslie M. Shaw, PhD, Laszlo Sarkozi, PhD,Richard Mullins, PhD, John Pirsch, MD, Gordon MacFarlane, PhD,Dan Scheller, BS, Diana Ersfeld, BA, Mary Frick, MS,William E. Fitzsimmons, PharmD, Mohammed Virji, MD, Ashok Jain, MD,Kenneth L. Brayman, MD, and Abraham Shaked, MDThe relationship between the dose of tacrolimus, troughcreasing risk of acute rejection was demonstrated over atacrolimus blood concentration, and selected clinical end-7-day time window. Nephrotoxicity and other toxicities alsopoints (acute rejection, nephrotoxicity, and other toxicities)demonstrated statistically significant relationships withwere examined in a prospective, multicenter clinical trial totrough tacrolimus blood concentrations. The results of thevalidate the use of an enzyme-linked immunosorbent assayCox analysis were consistent with the logistic regression(ELISA) for monitoring whole-blood concentrations ofanalysis. Using receiver operator characteristic curves,tacrolimus in liver transplant patients. A total of 111 subjectstrough tacrolimus concentrations as measured by the ELISAfrom six transplant centers were evaluated over 12 weeksmethod were able to differentiate the occurrence ofposttransplantation. In addition to trough tacrolimus bloodnephrotoxicity and toxicity from nonevents. To minimizeconcentrations, hematocrit, ALT, AST, GGTP, alkalinenephrotoxicity of tacrolimus, it is necessary to maintainphosphatase, total bilirubin, serum creatinine, BUN, serumtrough blood concentrations below 15 ng/ml. This studypotassium, serum magnesium, blood glucose, and serum al-demonstrates that the ELISA method used to measurebumin were also measured. The relationship between troughtacrolimus blood concentrations in this study provides in-tacrolimus blood concentrations and clinical endpoints wasformation of predictive value for managing the risk ofanalyzed using both a logistic regression model and a Coxnephrotoxicity, other toxicity, and rejection in liver trans-proportional hazard model. By logistic regression analysis, astatistically significant (p = 0.0465) relationship between in-Journal of Clinical Pharmacology, 2001;41:542-551 creasing trough tacrolimus blood concentrations and de-2001 the American College of Clinical Pharmacology
From the Department of Pharmaceutical Sciences, Pathology, and Surgery,University of Pittsburgh, Pennsylvania (Dr. Venkataramanan, Dr. Virji, Dr. The contribution of tacrolimus to effective
immunosuppression in the field of organ trans-
Jain); the Department of Clinical Chemistry and Surgery, University of
plantation is well established.1-4 While tacrolimus is a
Pennsylvania Medical Center, Philadelphia (Dr. Shaw, Dr. Brayman, Dr.
potent immunosuppressive drug, it has a narrow thera-
Shaked); the Department of Clinical Chemistry, Mt. Sinai Medical Center,
peutic index.5-7 The large interindividual variation in
New York (Dr. Sarkozi); the Department of Clinical Chemistry, Emory Uni-
the pharmacokinetics of tacrolimus necessitates indi-
versity, Atlanta, Georgia (Dr. Mullins); Department of Clinical Chemistry,
vidualization of the dosing regimen of tacrolimus in
University of Wisconsin Hospital and Clinics, Madison, Wisconsin (Dr.
transplant patients.8-10 In addition, to achieve long-term
Pirsch); DiaSorin, Inc., Stillwater, Minnesota (Dr. MacFarlane, Mr. Scheller,
graft survival, it is essential that the patients are com-
Ms. Frick, Ms. Ersfeld); and Fujisawa Healthcare, Inc., Deerfield, Illinois
pliant with the prescribed dosing regimen. Optimiza-
(Dr. Fitzsimmons). This work was supported by DiaSorin, Inc., Stillwater,
tion of tacrolimus therapy in organ transplant patients
Minnesota. Submitted for publication August 16, 2000; revised versionaccepted October 26, 2000. Address for reprints: Raman Venkatara-
currently uses routine tacrolimus trough-level moni-
manan, PhD, FCP, Professor of Pharmaceutical Sciences and Pathology,
toring as an integral component.11-12 One of the funda-
University of Pittsburgh, Pittsburgh, PA 15261.
mental premises in the application of therapeutic drug
542 · J Clin Pharmacol 2001;41:542-551 MONITORING TACROLIMUS BLOOD CONCENTRATIONS
monitoring is the documentation of a relationship be-
small as 92 subjects.19 In addition, the difference in the
tween the blood concentrations of a drug and its effi-
incidence of toxicity was shown to be 20% to 30%
cacy or toxicity. While there have been several causal
when subjects with high concentrations of tacrolimus
observations of association of rejection at lower con-
were compared with subjects with low concentrations
centrations and toxicity at higher concentrations of
of tacrolimus. Assuming a between-group difference of
tacrolimus,13-18 there has been only one thorough retro-
25% and a toxicity rate of 35% in the low concentration
spective analysis of the relationship between tacro-
group, a sample size of 94 subjects would be required to
limus blood concentrations and efficacy and toxicity in
detect such a difference, assuming α = 0.05 (one-sided)
transplant patients.19 In addition, the methods avail-
able to monitor tacrolimus concentrations differ partic-
Tacrolimus was given intravenously for the first few
ularly with respect to analytical sensitivity.20-23 The pri-
days after transplantation in two centers. Tacrolimus
mary goal of the current study was to prospectively
was given orally to all the subjects in other centers. Ad-
evaluate the relationship between tacrolimus blood
justments in the dose of tacrolimus were made on the
concentrations, as determined by an enzyme-linked
basis of the standard of care at each center and included
immunosorbent assay (ELISA), and the risk of rejection
blood level monitoring of tacrolimus20 and other clini-
and toxicity in liver transplant patients in a multicenter
cal indices such as serum bilirubin, alkaline phos-
PATIENTS AND METHODS Data Collection Patient Population
Baseline characteristics that included demographics,medical history, and clinical laboratory values were
In the present prospective study, we enrolled 111 adult
collected from all the subjects. Subjects were evaluated
liver transplant subjects between August 1996 and July
for 12 weeks posttransplantation. Morning trough
1997 at six clinical sites in the United States. These
tacrolimus concentrations (collected before the morn-
sites were the following: University of Pittsburgh Medi-
ing dose) and clinical laboratory measurements that in-
cal Center, Pittsburgh; University of Pennsylvania
cluded ALT, AST, alkaline phosphatase, GGTP, total
Medical Center, Philadelphia; Mt. Sinai Medical Cen-
bilirubin, serum creatinine, BUN, serum potassium, se-
ter, New York; Emory University, Atlanta, Georgia; Uni-
rum magnesium, blood glucose, albumin, and hema-
versity of Miami Medical School and VA Medical Cen-
tocrit were measured three times a week during weeks
ter, Miami, Florida; and University of Wisconsin
1 and 2, twice a week during weeks 3 and 4, once a
Hospitals and Clinics, Madison. The study protocol
week during weeks 5 and 6, and once every 2 weeks
was approved by the institutional review board at each
site. The study population was restricted to subjects re-
Tacrolimus trough concentrations were assayed in
ceiving tacrolimus as a primary immunosuppressant
whole blood by PRO-Trac™ II ELISA.21,22 Venous blood
following liver transplantation. Subjects receiving a
was collected in 5 or 10 mL evacuated glass tubes con-
liver from an ABO incompatible donor, subjects who
taining EDTA or heparin as the anticoagulant. No fur-
had prior organ transplantation other than the liver, or
ther additive or preservative was required to maintain
subjects who underwent transplantation of other or-
the integrity of the samples. Specimens not processed
gans at the time of liver transplantation were excluded
immediately were stored at –18°C to –25°C and ana-
from the study. Subjects were on a combination of
lyzed within 7 days. Under this storage condition,
tacrolimus, steroid, and azathioprine or mycopheno-
tacrolimus has been shown to be stable.22
late mofetil. Subjects did not receive any investiga-
Subjects were monitored for three primary end-
tional immunosuppressant, with the exception of
points: acute rejection confirmed by histology, nephro-
mycophenolate mofetil. Informed consent for partici-
toxicity defined as a serum creatinine elevation to
pation in the study was obtained from the subject or the
greater than two times the baseline value, and evidence
subject’s authorized legal representative prior to enroll-
of toxicity defined as any adverse event that required a
reduction in dose of tacrolimus. In addition, two sec-
The sample size estimation for the study was based
ondary endpoints, death and retransplantation due to
on previous logistic and Cox regression analyses of
graft failure, were also monitored. Parameters calcu-
clinical trials in which tacrolimus blood levels were
lated included time to endpoint (days from transplant
correlated positively with toxicity in populations as
to endpoint), tacrolimus trough level 0 to 7 days prior
to that endpoint, lowest tacrolimus trough within the
The clinical sensitivity and specificity were calculated
time window for rejection, and highest tacrolimus
for rejection, toxicity, and nephrotoxicity using re-
trough within the time window for all other endpoints.
ceiver operator characteristic (ROC) curves. Analyseswere performed using principles from the National
Statistical Analysis
Committee for Clinical Laboratory Standards, NCCLSdocument GP10-T (ISBN 1-56238-213-6). The receiver
The relationship between the dose of tacrolimus and
operator curves were displayed using a logistic regres-
the trough blood concentrations of tacrolimus was ana-
sion model to calculate the predictive accuracy of this
lyzed, using samples collected after 2 or more days of
model. The model includes tacrolimus blood concen-
tacrolimus administration. The relationship of tacro-
trations as continuous data and occurrence of rejection,
limus dose to steady-state tacrolimus trough levels was
toxicity, or nephrotoxicity as the dependent variable.
assessed using a repeated-measure analysis of variance
Bootstrapping and cross-validation methods were used
model. The predictive relationship between tacro-
to correct for the bias that results from using the same
limus concentration (measured using the PRO-Trac™ II
data for both fitting and testing the accuracy of the
ELISA) and the subject’s risk of experiencing endpoint
model. PC-SAS release 6.11 was used for all the statisti-
events was evaluated using logistic regression and Cox
proportional hazard regression analyses. Liver func-
Data collection and management were performed
tion tests were added to the model to assess their ability
under the supervision of an independent contract re-
search organization. Quality assurance procedures in-
The logistic regression model underlying these anal-
cluded monitoring of data to ensure that complete,
timely, and accurate data were submitted and that pro-tocol requirements were followed.
The logit (probability of event) = α + β X,
where α is the intercept parameter, and β is the vector ofslope parameters.
The pretransplant diagnosis and the demographics of
For the nephrotoxicity, toxicity, death, and retrans-
the study subjects are listed in Table I. In total, 111 sub-
jects were enrolled at six sites. Ten percent of the sub-jects were hepatitis B positive, 35% of the subjects
X = (maximum tacrolimus trough level).
were hepatitis C positive, 18% were diabetic, and 5%
were on dialysis. A total of 91 subjects receivedtacrolimus treatment throughout the 12 weeks of study.
X = (minimum tacrolimus trough level,
Twenty subjects received less than 12 weeks of treat-
ment with tacrolimus, and the reasons for early termi-nation of treatment were death, retransplantation, tox-
The Cox proportional hazard regression model was as
icity resulting in conversion to cyclosporine, or
Tacrolimus was administered intravenously during
the immediate postoperative period at two sites. At onesite, IV doses of tacrolimus were administered on an
where h (t) is an arbitrary and unspecified baseline
as-needed basis to achieve desired blood levels of
hazard function, z is the vector of measured explana-
tacrolimus, followed by orally administered mainte-
tory variables for the ith individual, and β is the vector
nance doses. At the second site, the standard of care
of unknown regression parameters associated with the
called for tacrolimus to be administered intravenously
at the time of surgery and for 2 to 3 days postopera-
For the nephrotoxicity, toxicity, death, and retrans-
tively, when patients often have difficulty tolerating
orally administered drugs. After the immediate postop-erative period, maintenance therapy was provided as
z = (maximum tacrolimus trough level).
oral doses. The mean oral tacrolimus dosage during
week 1 was 0.07 mg/kg/day, was essentially stable at0.10 to 0.11 mg/kg/day during weeks 2 through 9, de-
z = (minimum tacrolimus trough level,
clined to 0.09 mg/kg/day during weeks 10 and 11, and
was 0.07 mg/kg/day at week 12. Tacrolimus was ad-
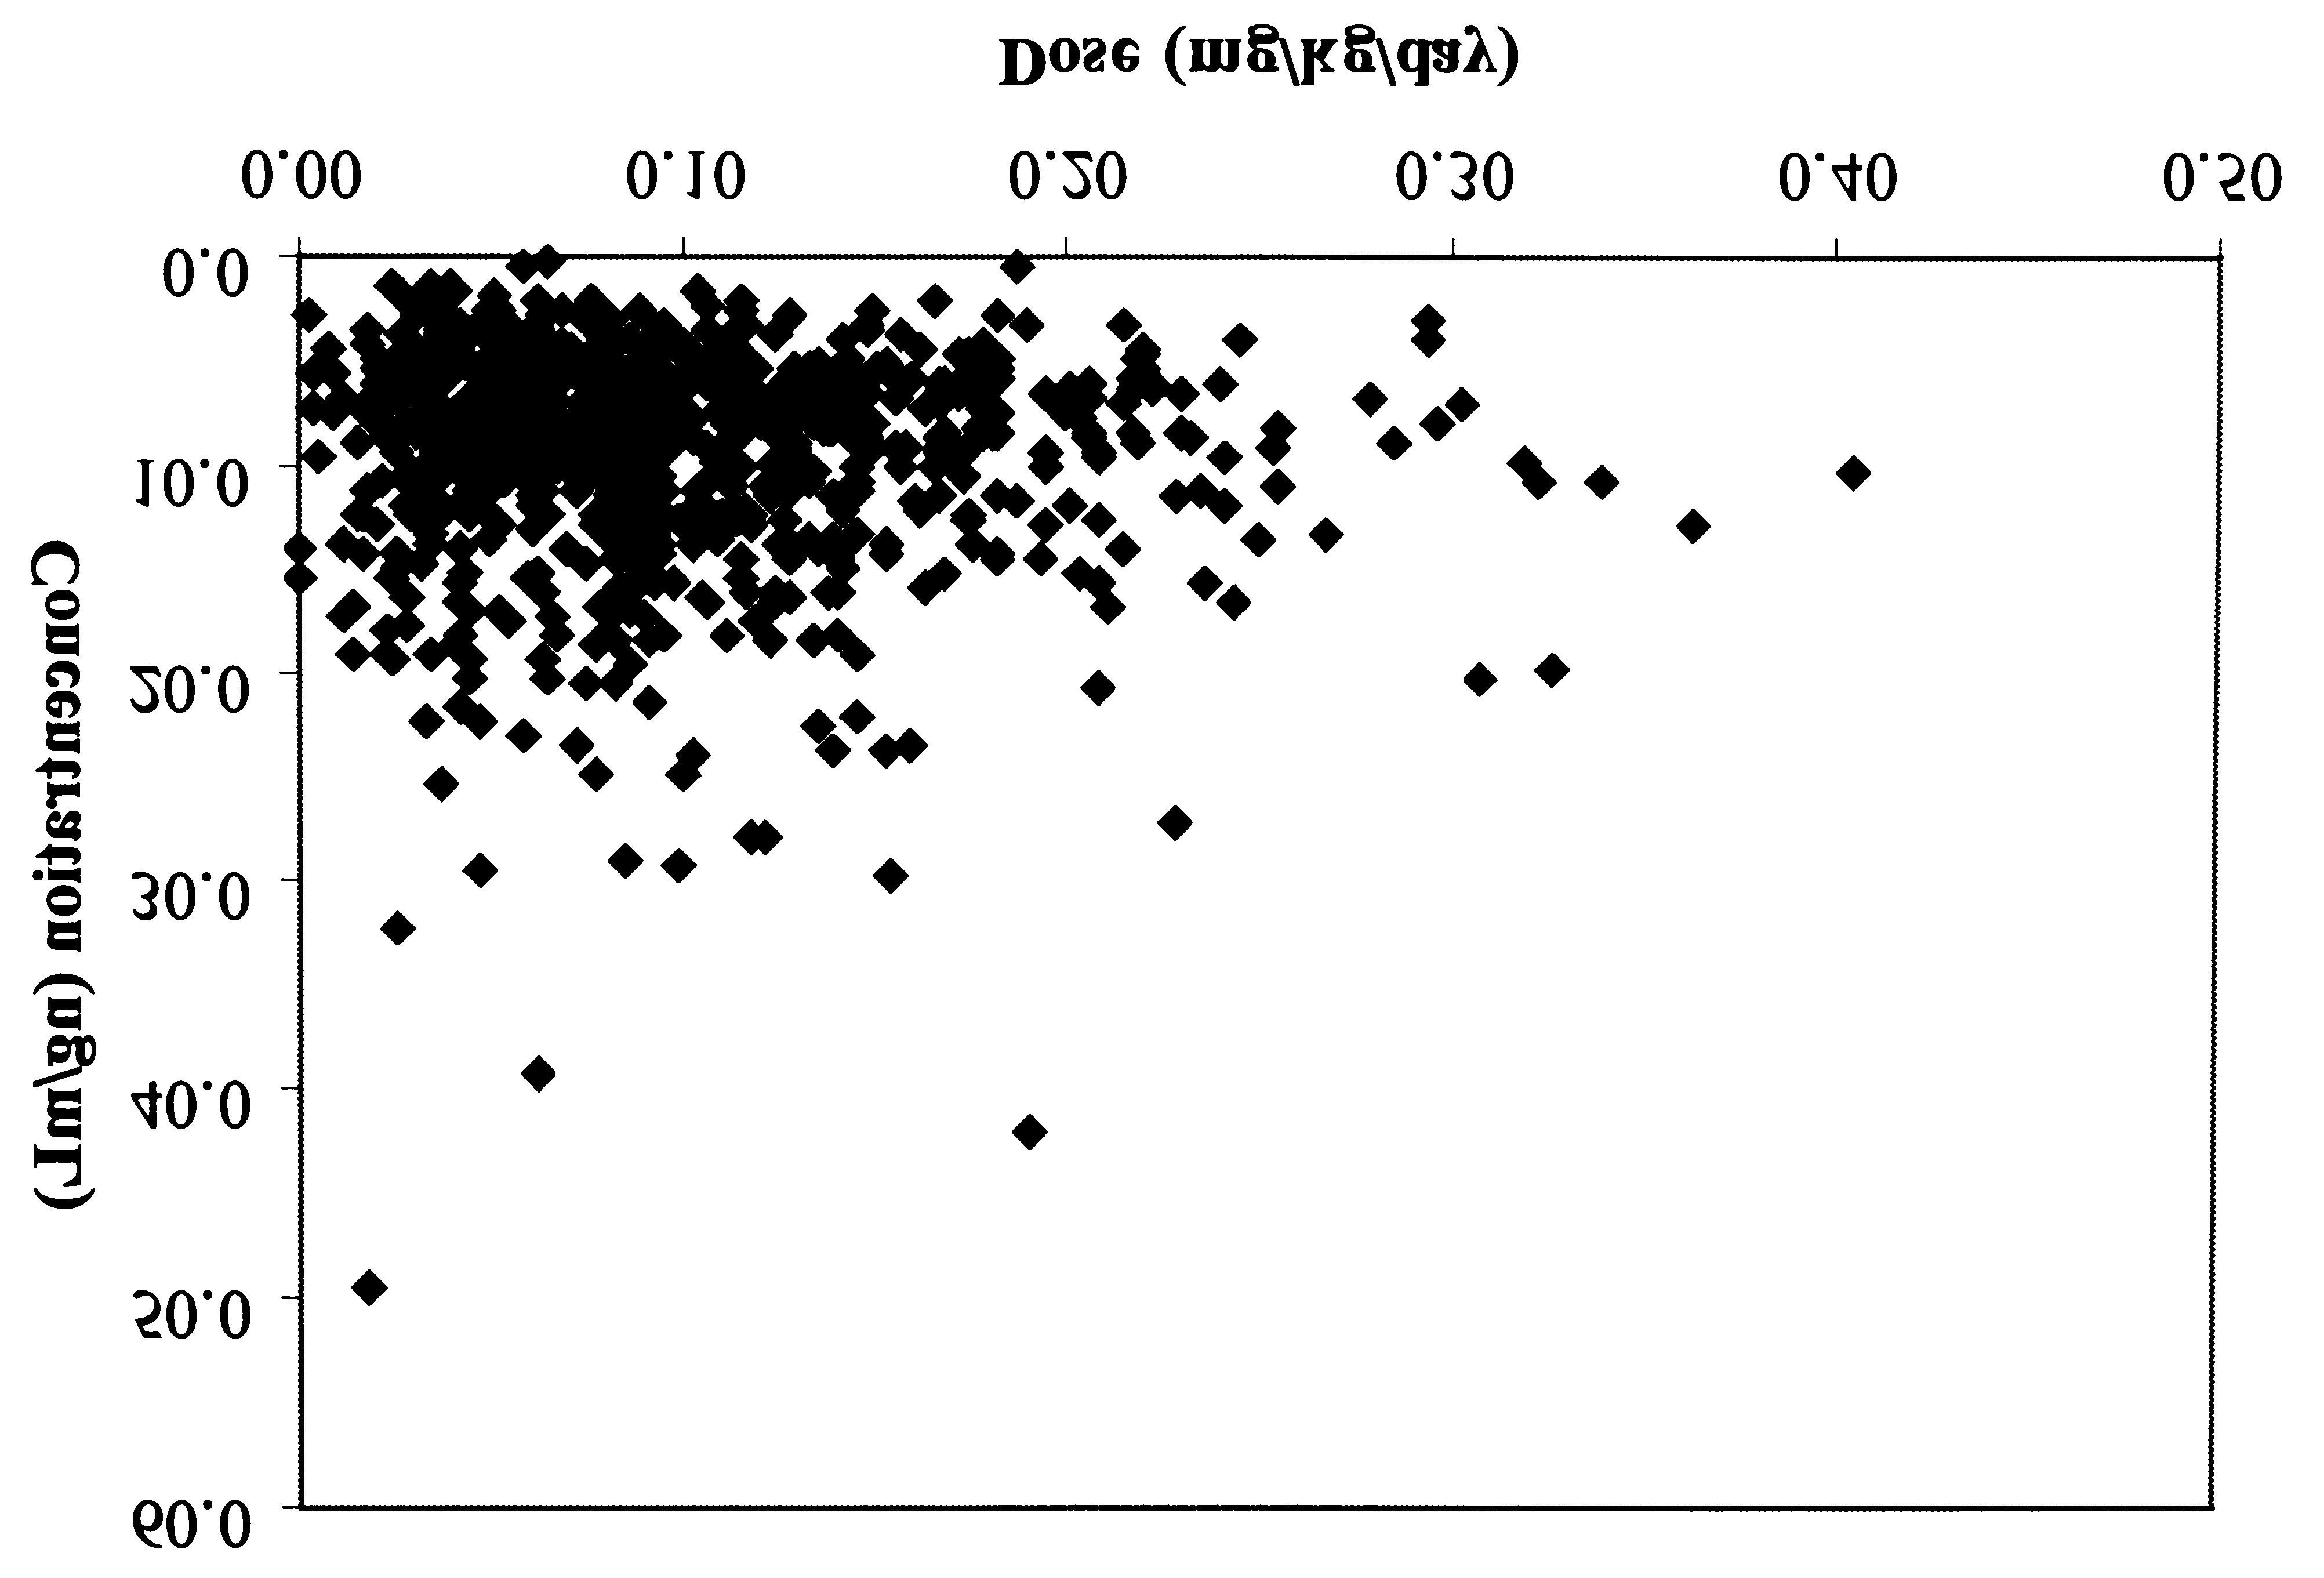
544 · J Clin Pharmacol 2001;41:542-551 MONITORING TACROLIMUS BLOOD CONCENTRATIONSTable I Subject Demographics and Table II Distribution of Clinical Endpoints First Event Characteristic/Parameter Clinical Endpoint Events (n) Only (n) Figure 1. Relationship between tacrolimus dose (mg/kg/day) andsteady-state whole-blood trough concentrations of tacrolimus.
ministered twice daily in all the subjects. Mean trough
bution of the clinical endpoints reached is shown in
blood concentrations of tacrolimus for the correspond-
Table II. Any instance of rejection not confirmed by
ing time periods were 10.4 ng/ml during week 1,
histology was excluded from analysis. Forty-seven per-
trending downward slightly to a low of 7.7 ng/ml dur-
cent of the first-rejection episodes occurred within the
ing week 11, and was 8.1 ng/ml during week 12. The re-
first 10 days, 16% occurred between 11 and 20 days,
lationship of dose to tacrolimus blood concentrations
13% occurred between 21 and 30 days, and 24% after
for individual subjects is shown in Figure 1. The ability
30 days of transplantation. During the 12 weeks of this
to predict the trough blood concentrations of tacro-
study, patient survival was 97% (3 of 111 subjects
limus based on the dose administered for a given indi-
died), and graft survival was 93% (8 of the 111 subjects
Clinical Endpoints Logistic Regression Analysis
Of the 111 subjects enrolled in the study, 60 (54%)
The clinical data were subjected to logistic regression
experienced a total of 95 clinical endpoint events.
analysis to determine the relationship between blood
Thirty-six subjects experienced acute rejection, 38 sub-
concentrations of tacrolimus and clinical endpoints.
jects experienced nephrotoxicity, 10 subjects experi-
The results are summarized in Table III.
enced other toxicity thought to be related to tacrolimus,
Acute rejection. Based on the analysis of the 0- to
3 subjects died, and 8 were retransplanted. The distri-
7-day window prior to a biopsy-proven rejection event,
Table III Summary of Logistic Regression Analysis Number of Endpoints Observations Odds Ratio p
Acute rejection with significant mean LFT
there is a statistically significant (p = 0.0465) relation-ship between increasing trough tacrolimus blood con-centrations and decreasing risk of acute rejection. Thisanalysis controls for the additive predictive effects ofmean liver function tests in the same time window byincluding them as covariates in the regression model. The odds ratio associated with increasing tacrolimustrough concentrations and the risk of acute rejection is0.80 (mean liver function tests controlled). Nephrotoxicity. Based on the analysis of the 0- to
7-day window prior to nephrotoxicity, a statisticallysignificant (p = 0.0001) correlation between increasingtacrolimus trough concentrations and increasing risk ofnephrotoxicity is demonstrated. The odds ratio associ-
Figure 2. Plot of incidence rate for nephrotoxicity (circles), rejec-
ated with increasing tacrolimus levels and the risk of
tion (squares), and toxicity (triangles) using 0- to 7-day time windowToxicity. A statistically significant correlation (p =
0.0387) of increasing tacrolimus trough concentrationsand increasing risk of toxicity is found in the 0- to
tacrolimus blood levels increase, and the probability
14-day window, with a supportive but nonstatistically
of toxicity requiring a reduction in tacrolimus dosage
significant correlation (p = 0.0964) in the 0- to 7-day
increases modestly as tacrolimus concentrations
window. The risk associated between increasing
tacrolimus trough concentrations and toxicity (odds ra-tio of 1.071) is less pronounced than that for acute re-
Cox Proportional Hazard Regression Analysis Relationship of Tacrolimus
The results with the Cox model as reported in Table IV
Levels to Clinical Endpoints
were consistent with the results from the logistic re-gression analysis. The directional relationship of
The probability of nephrotoxicity, rejection, and toxic-
tacrolimus trough concentrations to the risk of acute re-
ity based on logistic regression analysis is plotted in
jection, nephrotoxicity, and toxicity is the same as
Figure 2. This figure indicates that the probability of re-
those of the logistic regression analysis. The magni-
jection decreases as whole-blood levels of tacrolimus
tudes of the risk ratios were similar to the odds ratios
increase, the probability of nephrotoxicity increases as
for the logistic regressions, although the risk ratio for
546 · J Clin Pharmacol 2001;41:542-551 MONITORING TACROLIMUS BLOOD CONCENTRATIONSTable IV Summary of Cox Proportional Hazards Analysis Coefficient of Endpoint Variance Risk Ratio p
Acute rejection with significant mean LFT
rejection and nephrotoxicity was less using the Coxanalysis. The strength of the relationship between in-creasing levels of maximum tacrolimus trough concen-trations and the risk of toxicity is greater in the Coxmodel. Clinical Sensitivity and Specificity
Clinical accuracy of tacrolimus blood concentrationsin predicting the occurrence of primary clinical end-points is summarized graphically in the ROC curvespresented in Figures 3 through 6. Although thetacrolimus blood concentration has a statistically sig-
Figure 3. Receiver operating characteristic curve for rejection with
nificant contribution in the prediction of acute rejec-
trough concentration in the 0- to 7-day window. This curve describes
tion, ROC curves for rejection indicate that the liver
that tacrolimus blood concentrations alone cannot differentiate be-
function tests are the major contributors to differentiat-
tween acute rejection and a nonevent with good sensitivity.
ing the occurrence of acute rejection from a nonevent(Figures 3, 4). The optimal clinical sensitivity/specific-ity pairs for acute rejection, based on the maximumALT value in the 7-day window prior to the event, were88% and 75%, respectively, at 200 IU/L. Described interms of clinical sensitivity and 1-specificity, the ROCcurves for nephrotoxicity and toxicity (Figures 5, 6) in-dicate that tacrolimus blood levels as measured byPro-Trac™ II ELISA in the 0- to 7-day window are ableto differentiate the occurrence of these adverse eventsfrom nonevents.
For nephrotoxicity and toxicity, the trough concen-
trations that give the highest clinical sensitivity/speci-ficity pairs are summarized in Table V. These clinicalstudy results would indicate that discrimination for
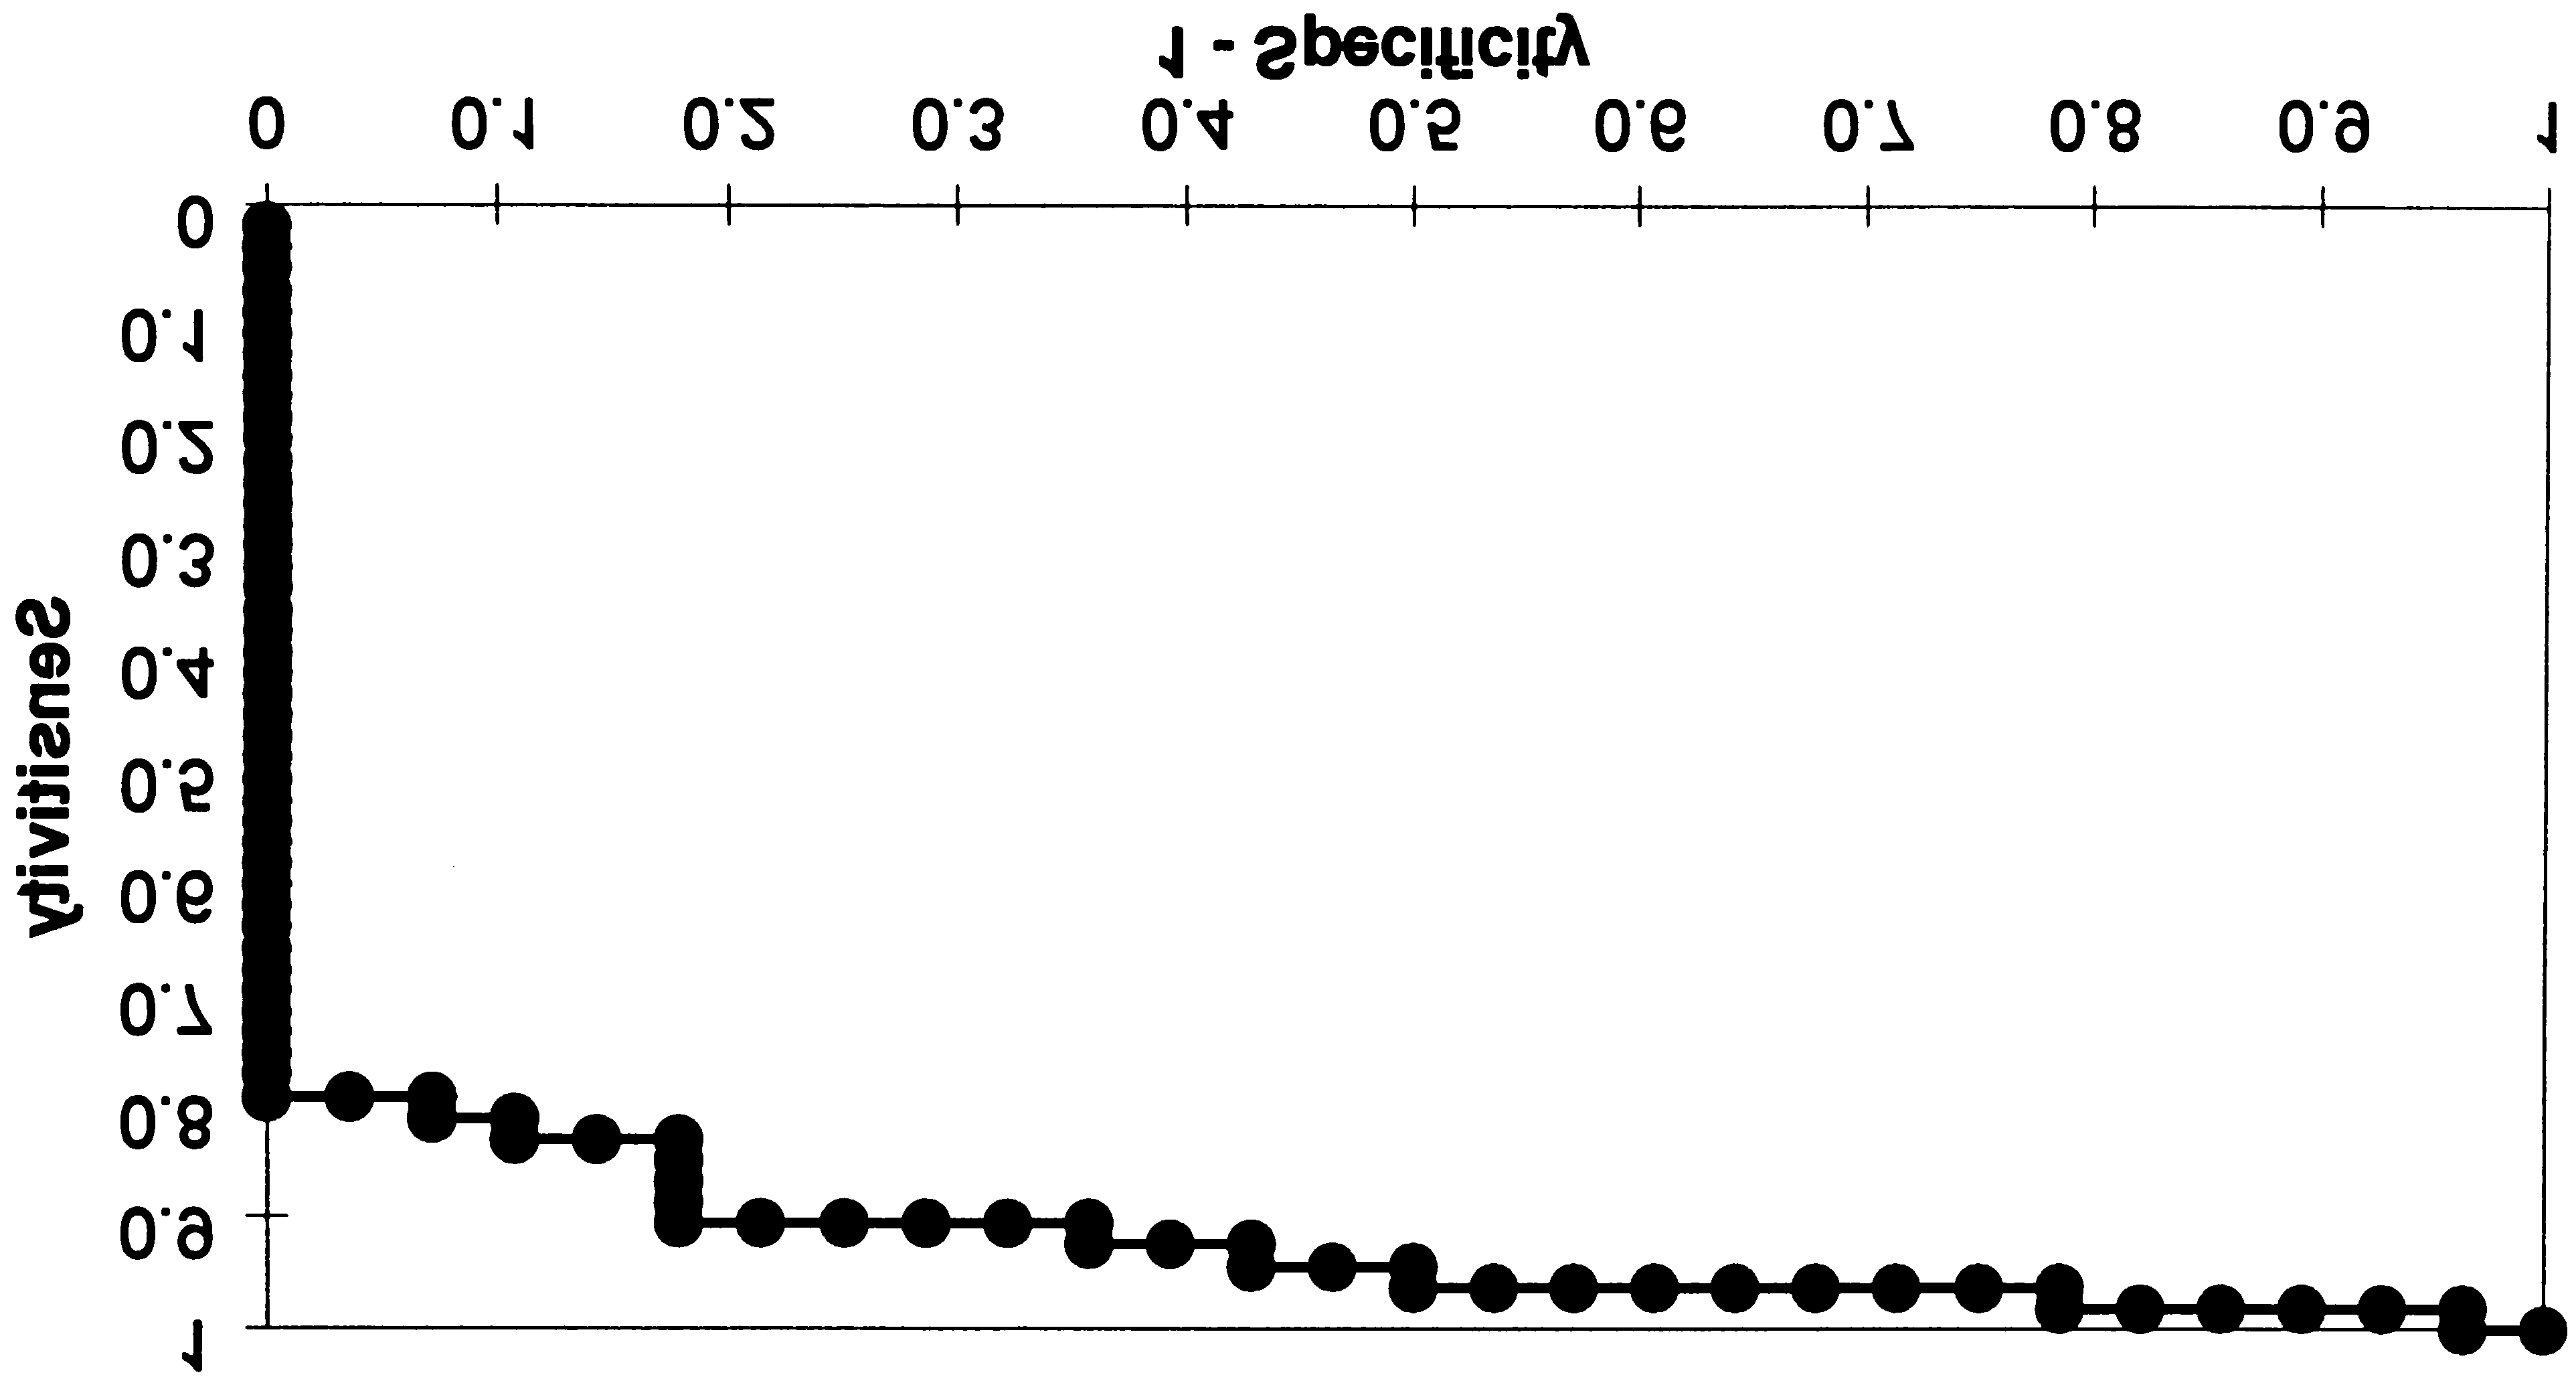
Figure 4. Receiver operating characteristic curve for rejection with
toxicity is greatest at trough concentrations of approxi-
trough concentrations and liver function tests (max ALT) in the 0- to
mately 12 ng/mL and that for nephrotoxicity, discrimi-
7-day window. This curve describes that liver function tests can pre-
nation is greatest at a range from 12 to 15 ng/mL. Con-
dict acute rejection with high sensitivity.Figure 5. Receiver operating characteristic curve for nephrotoxicityFigure 6. Receiver operating characteristic curve for toxicity withwith trough level in the 0- to 7-day window.trough level in the 0- to 7-day window. This curve describes thattrough levels can differentiate adverse effect from a nonevent.
centrations of 15 ng/mL, which demonstrate higher
variation in the pharmacokinetics, and the need for
positive predictive values and greater specificity, are
long-term compliance to ensure graft survival in trans-
supported by current standards of practice.
plant patients.8-11 The importance of the need for thera-
There was no correlation between the trough blood
peutic monitoring of tacrolimus is also supported by
concentrations of tacrolimus and the time to first-
the present study, confirming the poor correlation be-
rejection episode or the time to nephrotoxicity or time
tween the daily dose (mg/kg/day) and the steady-state
whole-blood concentrations achieved.
During the early clinical trials, tacrolimus concen-
DISCUSSION
trations were measured in plasma due to nonavailabil-ity of an assay to measure the concentrations in whole
Therapeutic monitoring of tacrolimus is routinely per-
blood. An analysis of tacrolimus concentrations in
formed in transplant patients. Therapeutic monitoring
these early studies indicated that nephrotoxicity, when
of tacrolimus has been recommended due to the nar-
other nephrotoxic factors were excluded, was associ-
row therapeutic index, large inter- and intraindividual
ated with high plasma trough concentrations.6 Elevated
Table V Clinical Sensitivity and Specificity of Tacrolimus Trough Concentrations
for Nephrotoxicity and Toxicity Requiring Dose Reduction (in percentages)
Predictive Values Trough Concentration Sensitivity Specificity Positive Negative 548 · J Clin Pharmacol 2001;41:542-551 MONITORING TACROLIMUS BLOOD CONCENTRATIONS
plasma tacrolimus concentrations and a higher rate of
centration to the incidence of rejection in liver trans-
renal dysfunction, often requiring dialysis, were ob-
plant patients using the MEIA procedure19 contrasted
served in liver transplant patients with poor graft func-
to the observations in this study (Figure 2).
tion.24-25 This association was subsequently confirmed
This study used logistic regression analysis and a
in a single-center study.15 A plasma concentration–
Cox proportional hazards regression model to evaluate
guided regimen was developed that reduced the inci-
the relationship between blood concentration and clin-
dence of tacrolimus side effects while maintaining ade-
ical endpoints within a 7-day window. This approach,
quate immunosuppression.26 In contrast, a retrospec-
applied to a 12-week posttransplant time period when
tive analysis of 13,000 samples from 248 liver
most endpoints occur and complete data collection can
transplant patients suggested a poor correlation be-
be made with reasonable confidence, has been shown
tween plasma concentration and toxicity.27
to be successful in past analyses.19 These analyses do
Subsequently, whole blood has become the pre-
not predict an individual subject’s response to a spe-
ferred matrix for tacrolimus concentration measure-
cific tacrolimus concentration but instead provide the
ment.11 In a study of kidney transplant patients, whole-
clinician with an assessment of the relative risks of
blood concentrations of tacrolimus correlated better
acute rejection and nephrotoxicity associated with the
with kidney function than plasma concentrations.14 A
given tacrolimus blood concentration. This risk assess-
similar association between blood concentration and
ment, as shown here and by others,19 is suggested to be
toxicity was reported in a retrospective analysis of mul-
dependent on the monitoring methodology.
tiple clinical trials in renal transplant patients.19
The ROC curve analysis attempts to provide the cli-
There have been conflicting reports regarding the as-
nician with data that can be used in direct patient man-
sociation of trough plasma or whole-blood tacrolimus
agement. These curves suggest that ALT values may
concentrations and acute rejection in liver transplant
provide the best clinical sensitivity and specificity for
patients. Whole-blood concentrations have been re-
the prevention of acute rejection within a 7-day win-
ported to correlate well,17,27 while whole-blood or
dow. Optimal sensitivity/specificity pairs occur at ALT
plasma concentrations showed poor correlation15,19 or
concentrations of approximately 200 IU/L. Tacrolimus
no significant difference between patients with and
concentrations alone were not sufficient to discrimi-
without rejection episodes.28-30 In pediatric liver trans-
nate rejection from nonevents. This is perhaps related
plant patients, rejection was shown to be most frequent
to some of the variability in the immunosuppressive
at blood concentrations less than 10 ng/mL.16 However,
regimen used in the study patients. While all the pa-
a more recent study did not show an association be-
tients received tacrolimus as the primary immunosup-
tween blood concentration and rejection in pediatric
pressive agent, 88% of the patients also received
methylprednisolone, 53% of the patients were also on
Similarly conflicting associations between tacro-
prednisone, and 44% of the patients were on myco-
limus concentrations and acute rejection have been re-
phenolate mofetil. Less than 5% of the patients re-
ported for renal transplant patients.13-14 In a retrospec-
ceived azathiporine or OKT3. It was not possible to
tive analysis of trough whole-blood concentrations
carry out statistical analysis of the subgroups due to
within a 7-day window before the onset of rejection,
limitations in the number of subjects in each group.
blood concentrations were well correlated with the on-
In contrast, tacrolimus concentrations alone could
set of rejection.19 As blood concentrations increased,
discriminate between nephrotoxicity and nonevents
the incidence of acute rejection was reduced while the
with optimal sensitivity/specificity achieved at ap-
incidence of adverse events was increased.
proximately 12 ng/mL. This information provides a
A microparticulate enzyme immunoassay (MEIA)
confirmation of the evolving clinical standard of prac-
procedure for the IMx® analyzer20 and an ELISA proce-
tice of reducing the upper limit of the recommended
dure21,22 are the two commercially available immuno-
trough tacrolimus blood concentrations from 20 ng/mL
assays for the measurement of tacrolimus in whole
as recommended by the Lake Louise Consensus re-
blood. In this study, we validated the clinical utility of
port.11 Even though not all potential nontacrolimus
the ELISA methodology. This method correlates well
causes of nephrotoxicity were assessed in this study,
with the HPLC/MS/MS reference methodology by lin-
none of the subjects exhibiting nephrotoxicity were re-
ear regression, Bland/Altman analysis, and Student’s
ceiving aminoglycosides or amphoterecin B during the
t-test.21,22 Correlation of the ELISA to the MEIA method-
7-day window prior to the nephrotoxic event.
ology shows a statistically significant difference be-
In conclusion, monitoring tacrolimus blood concen-
tween the two assays.22 The inability to correlate con-
trations by the PRO-Trac™ II ELISA method provides
the clinician with information of predictive value for
14. Japanese FK 506 Study Group: Japanese study of FK 506 on kid-
managing the risk of nephrotoxicity and acute rejection
ney transplantation: the benefit of monitoring the whole blood FK
in liver transplant patients. Routine monitoring of
506 concentration. Transplant Proc 1991;23:3085-3088.
tacrolimus blood concentrations must be used in con-
15. Backman L, Nicar M, Levy M, Distant D, Eisenstein C, Renard T, Goldstein R, Husberg B, Gonwa TA, Klintmalm G: FK506 trough lev-
junction with appropriate clinical evaluation of the pa-
els in whole blood and plasma in liver transplant recipients. Trans-
tient to optimize immunosuppressive therapy. plantation 1994;57:519-525. 16. Yasuhara M, Hashida T, Toraguchi M, Hasimoto Y, Kimura M,
The authors thank the following investigators for their support of
Inui K, Hori R, Inomata Y, Tanaka K, Yamaoka Y: Pharmacokinetics
the work reported here: V. Esquanazi, S. Babishkin, I. Fernandez,
and pharmacodynamics of FK 506 in pediatric patients receiving
S. Mehta, B. Forrester, S. Zuckerman, E. Culligan, R. Cupiola,
living-related donor liver transplantation. Transplant Proc 1995;27:
D. Wiebe, R. Miller, L. Ramanathan, L. Maxwell, R. Wheaton, and
17. Schwartz M, Holst B, Facklam D, Buell D, the U.S. Multicenter FK 506 Dose Optimization Study Group: FK506 in liver transplantation: REFERENCES
correlation of whole blood levels with efficacy and toxicity. The U.S. Multicenter FK506 Dose Optimization Study Group. Transplant Proc1. Starzl TE, Todo S, Fung J, et al: FK506 for liver, kidney and pan-
creas transplantation. Lancet 1989;2:1000-1004. 18. Winkler M, Jost U, Rings B, et al: Association of elevated FK506 2. Todo S, Fung J, Starzl TE, et al: Liver kidney and thoracic organ
plasma levels with nephrotoxicity in liver grafted patients. Trans-
transplantation under FK506. Ann Surg 1990;212:295-302. plant Proc 1991;23:3153-3155. 3. European FK506 Multicenter Liver Study Group: Randomized 19. Kershner R, Fitzsimmons F: Relationship of FK506 whole blood
trial comparing tacrolimus (FK506) and cyclosporine in prevention
concentrations and efficacy and toxicity after liver and kidney trans-
of liver allograft rejection. Lancet 1994;344:423-428.
plantation. Transplant Proc 1996;62:920-926. 4. The U.S. Multicenter FK506 Liver Study Group: A comparison of 20. Grenier FC, Luczkiw T, Bergmann M, et al: A whole blood FK506
tacrolimus (FK506) and cyclosporine for immunosuppression in
assay for the 1Mx analyzer. Transplant Proc 1991;23:2748-2749.
liver transplantation. N Engl J Med 1994;331:1110-1117. 21. MacFarlane GD, Scheller D, Ersfeld D, Jensen T, Jevans A, 5. McMaster P, Mirza DF, Ismail T, Vennarecci G, Patapis P, Mayer AD:
Kobayashi M: A simplified whole blood ELISA [ProTrac™ II] for
Therapeutic monitoring of tacrolimus in clinical transplantation.
tacrolimus (FK506) using a proteolytic extraction in place of organic
Ther Drug Monit 1995;17:602-606.
solvents. Ther Drug Monit 1996;18:698-705. 6. Alessiani M, Cillo U, Fung J, Irish W, Abu-Elmagd K, Jain A, 22. MacFarlane GD, Scheller DG, Ersfeld DL, Shaw LM, Venka-
Takaya S, Van Thiel D, Starzl T: Adverse effects of FK 506 overdosage
taramanan R, Sarkozi L, Mullins R, Fox B: Analytical validation of
after liver transplantation. Transplant Proc 1993;25:628-634.
the PRO-Trac II ELISA for the determination of Tacrolimus (FK506)
7. Fung JJ, Alessiani M, Abu-Elmagd K, Todo S, Shapiro R, Tzakis A,
in whole blood. Clin Chem 1999;45:1449-1458.
Van Thiel D, Armitage J, Jain A, McCauley J, Selby R, Starzl TE: Ad-
23. MacFarlane GD, Shaw LM, Venkataramanan R, Mullins R,
verse effects associated with the use of FK 506. Transplant Proc
Scheller DG, Ersfeld DL: Analysis of whole blood tacrolimus concen-
trations in liver transplant patients exhibiting impaired liver func-
8. Venkataramanan R, Swaminathan A, Prasad T, Jain A, Zuckerman S,
tion. Ther Drug Monit 1999;21:585-592.
Warty V, McMichael J, Lever J, Burckart G, Starzl T: Clinical phar-
24. Abu-Elmagd KM, Fung JJ, Alessiani M, et al: The effect of graft
macokinetics of tacrolimus. Clin Pharmacokinet 1995;29:404-
function on FK 506 plasma levels, dosages, and renal function, with
particular reference to the liver. Transplantation 1991;52:71-77. 9. Tsunoda S, Aweeka F: The use of therapeutic drug monitoring to 25. Abu-Elmagd KM, Fung JJ, Alessiani M, et al: Strategy of FK 506
optimize immunosuppressive therapy. Clin Pharmacokinet 1996;2:
therapy in liver transplant patients: effect of graft function. Trans-plant Proc 1991;23:2777-2780. 10. Kelly P, Burckart G, Venkataramanan R: Review of the new 26. Winkler M, Ringe B, Jost U, Gubermatis G, Pichlmayr R: Plasma
immunosuppressive agent tacrolimus (FK-506). Am J Health-System
level-guided low-dose FK 506 therapy in patients with early liver
dysfunction after liver transplantation. Transplant Proc 1993;25:
11. Jusko W, Thomson A, Fung J, McMaster P, Wong S, Zylber-Katz E,
Christians U, Winkler M, Fitzsimmons W, Lieberman R, McBride J,
27. Winkler M, Ringe B, Baumann J, Loss M, Wonigeit K, Pichlmayr R:
Kobayashi M, Warty V, Soldin S: Consensus document: therapeutic
Plasma vs whole blood for therapeutic drug monitoring of patients
monitoring of tacrolimus (FK-506). Ther Drug Monit 1995;17:
receiving FK 506 for immunosuppression. Clin Chem 1994;40(12):
12. Shaw L, Holt D, Keown P, Venkataramanan R: Current opinions 28. Winkler M, Ringe B, Rodeck B, Melter M, Stoll K, Baumann J,
on therapeutic drug monitoring of immunosuppressive drugs. Clini-
Wonigeit K, Pichlmayr R: The use of plasma levels for FK 506 dos-
cal Therapeutics 1999;21:1632-1652.
ing in patients with liver transplantation. Transplant Proc 1994;7:
13. Takahara S, Kokado Y, Kameoka H, Takano Y, Jiang H,
Moutabarrik A, Ishibashi M, Okuyama A, Sonoda T: Monitoring of
29. Jain AB, Todo S, Fung J, Venkataramanan, Day R, Bryant J,
FK 506 blood levels in kidney transplant recipients. Transplant Proc
Abu-Elmagd K, Alessiani M, Takaya S, Tzakis A, Starzl TE: Correla-
tion of rejection episodes with FK506 dosage FK506 level and ste-
550 · J Clin Pharmacol 2001;41:542-551 MONITORING TACROLIMUS BLOOD CONCENTRATIONS
roids following primary orthotopic liver transplant. Transplant Proc31. MacFarlane G, Venkataramanan R, McDiarmid SV, Pirsch J,
Scheller DG, Ersfeld DL, Fitzsimmons W: Therapeutic drug monitor-
30. Sandborn W, Lawson G, Cody T, Porayko M, Hay J, Gores G, Steers J,
ing of tacrolimus in pediatric liver transplant patients. Pediatric
Krom R, Wiesner R: Early cellular rejection after orthotopic liver
transplantation correlates with low concentrations of FK506 inhepatic tissue. Hepatology 1995;21:70-76.
FICHE DE DONNEES DE SECURITE PHOBI GEL FOURMIS 1 IDENTIFICATION DE LA SUBSTANCE / PRÉPARATION ET DE LA SOCIÉTÉ / ENTREPRISE Nom commercial Type de produit : Voir fiche technique pour des informations détaillées. Responsable de la mise sur le marché : LODI Parc d'Activités des Quatre Routes35390 GRAND FOUGERAY FranceEmail contact: [email protected] N° de téléphone en
Festbericht Kantonales Turnfest in Wädenswil Am Morgen um 8:00 Uhr beginnen wir unsere Reise nach Wädenswil. Dort angekommen, werden zuerst Vereinsfotos zusammen mit den übriggebliebenen vom TV geschossen. Die einen machen sich daran das Zelt aufzustellen und die anderen machen sich auf zum einwärmen in Richtung Fachtest Allround. Um 11:35 Uhr ist Flavia, unsere super Fachtesttrainerin, schon
 MONITORING TACROLIMUS BLOOD CONCENTRATIONS
Table I Subject Demographics and
MONITORING TACROLIMUS BLOOD CONCENTRATIONS
Table I Subject Demographics and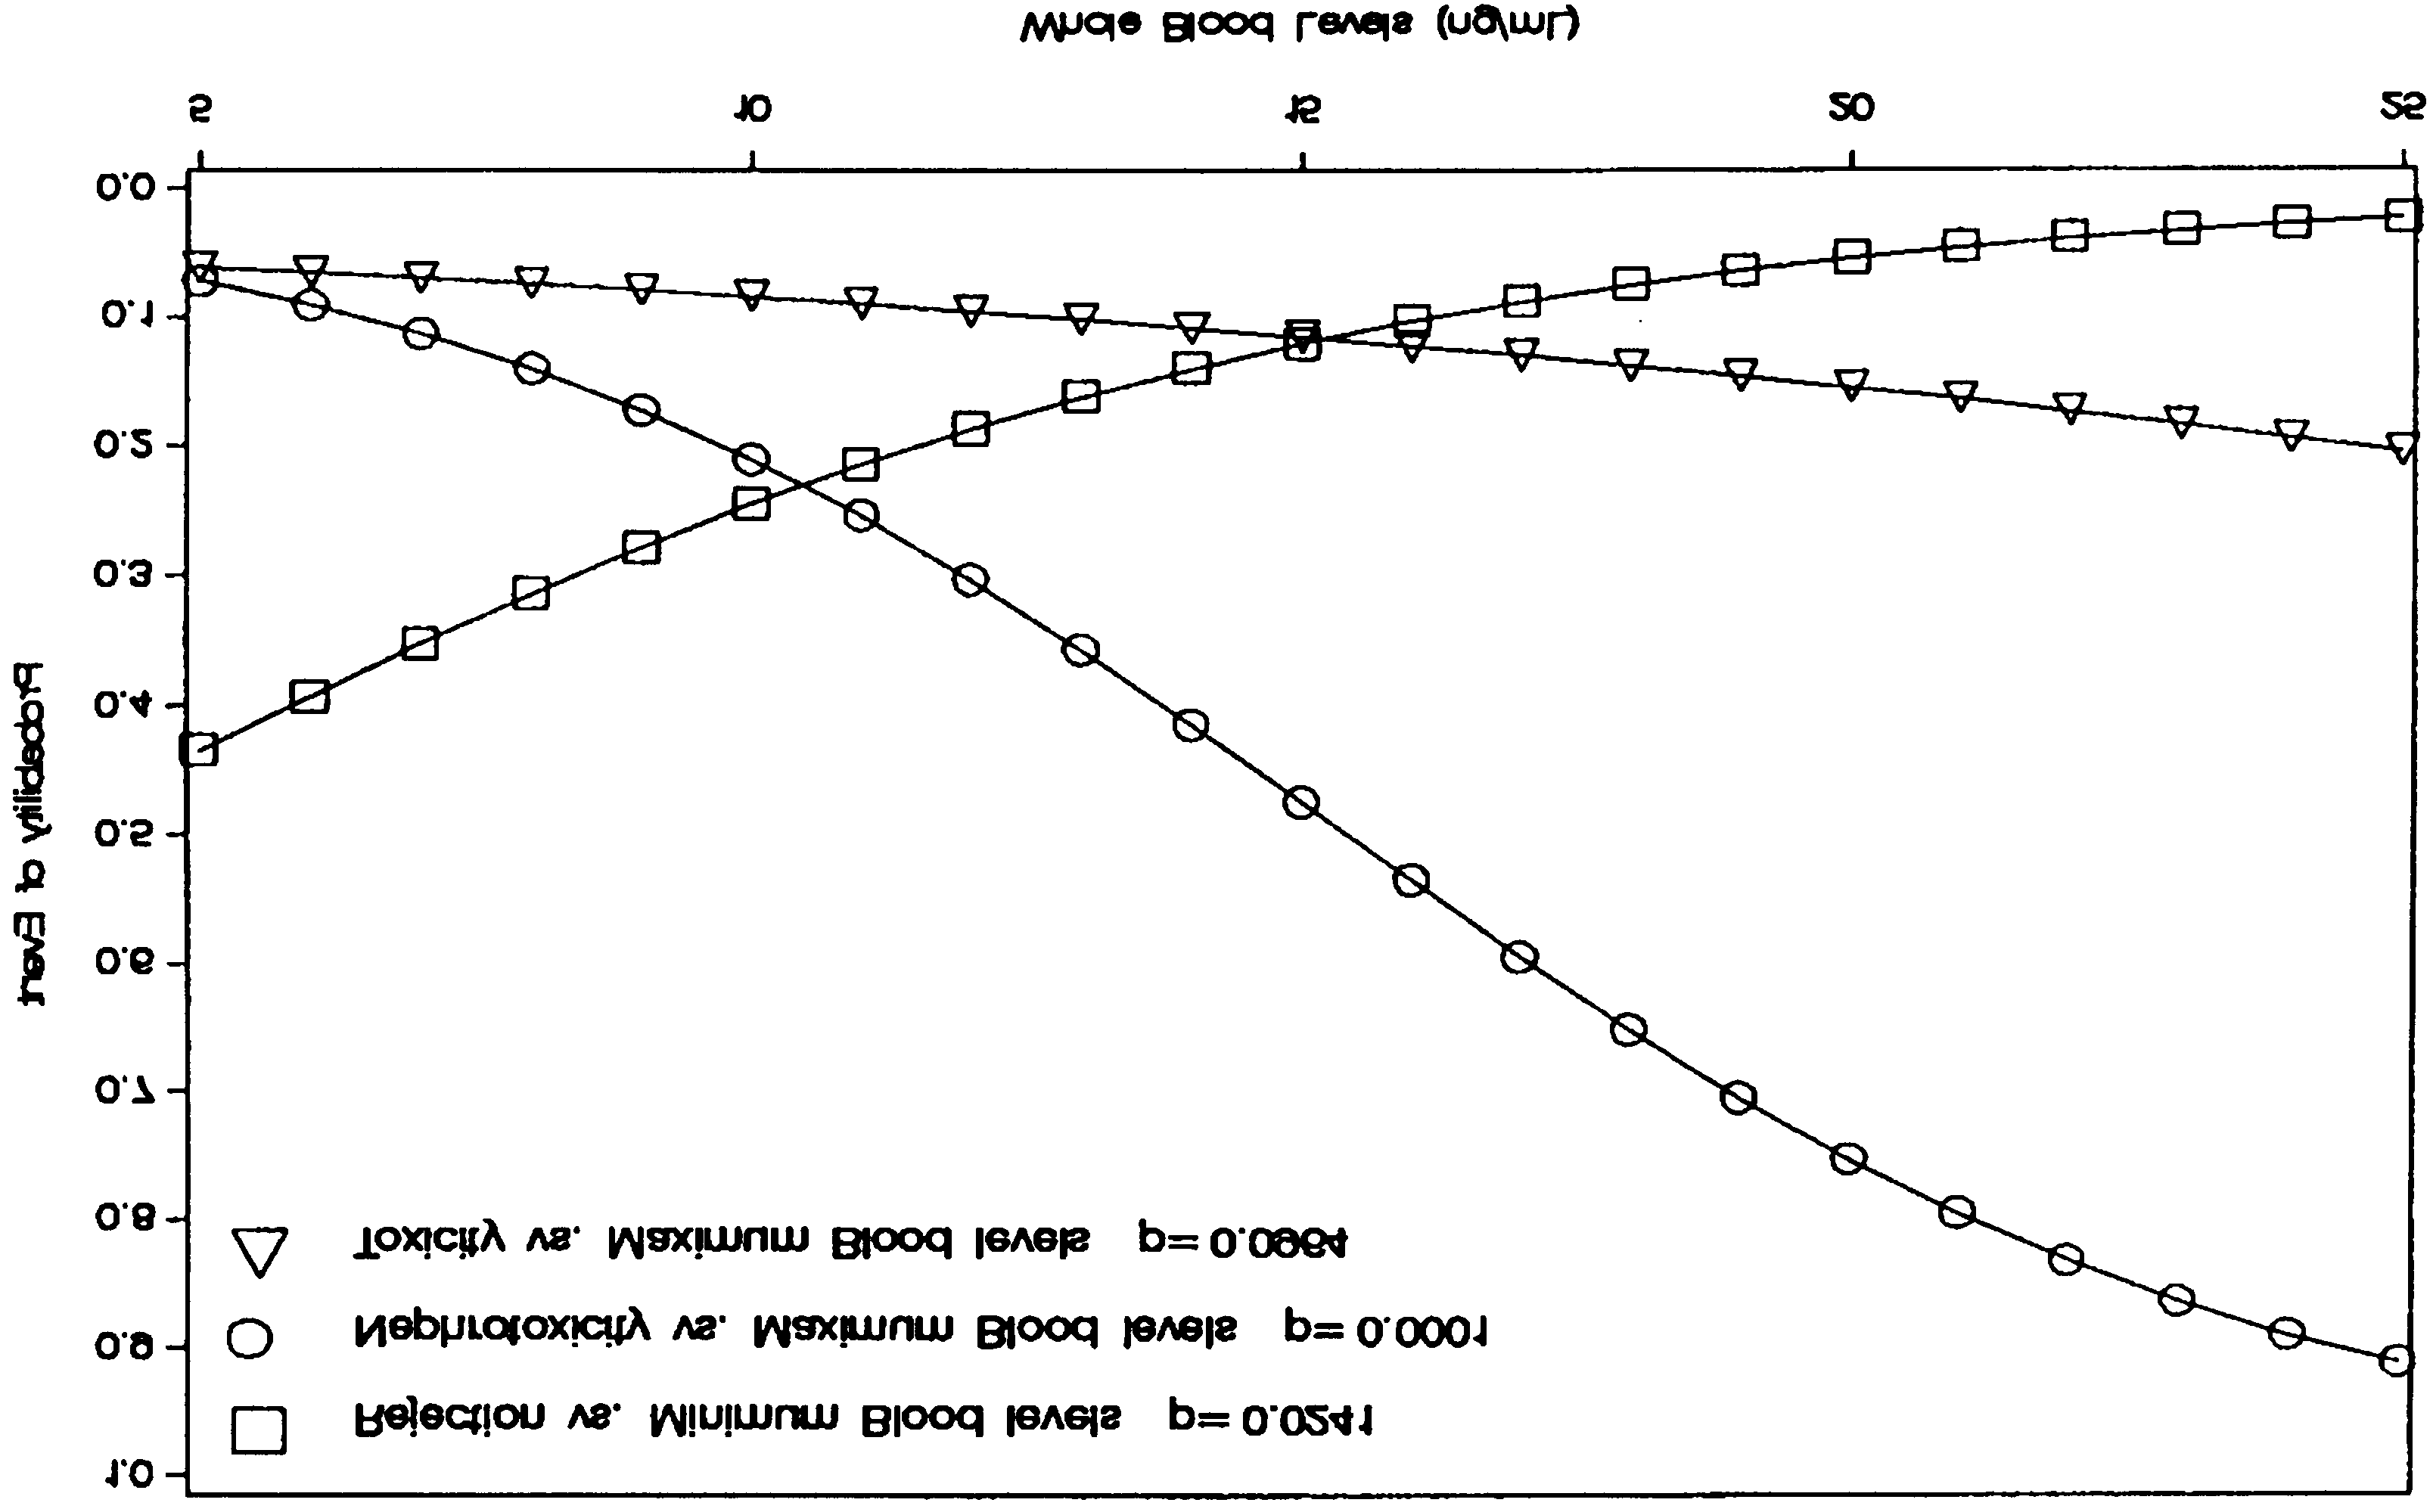 Table III Summary of Logistic Regression Analysis
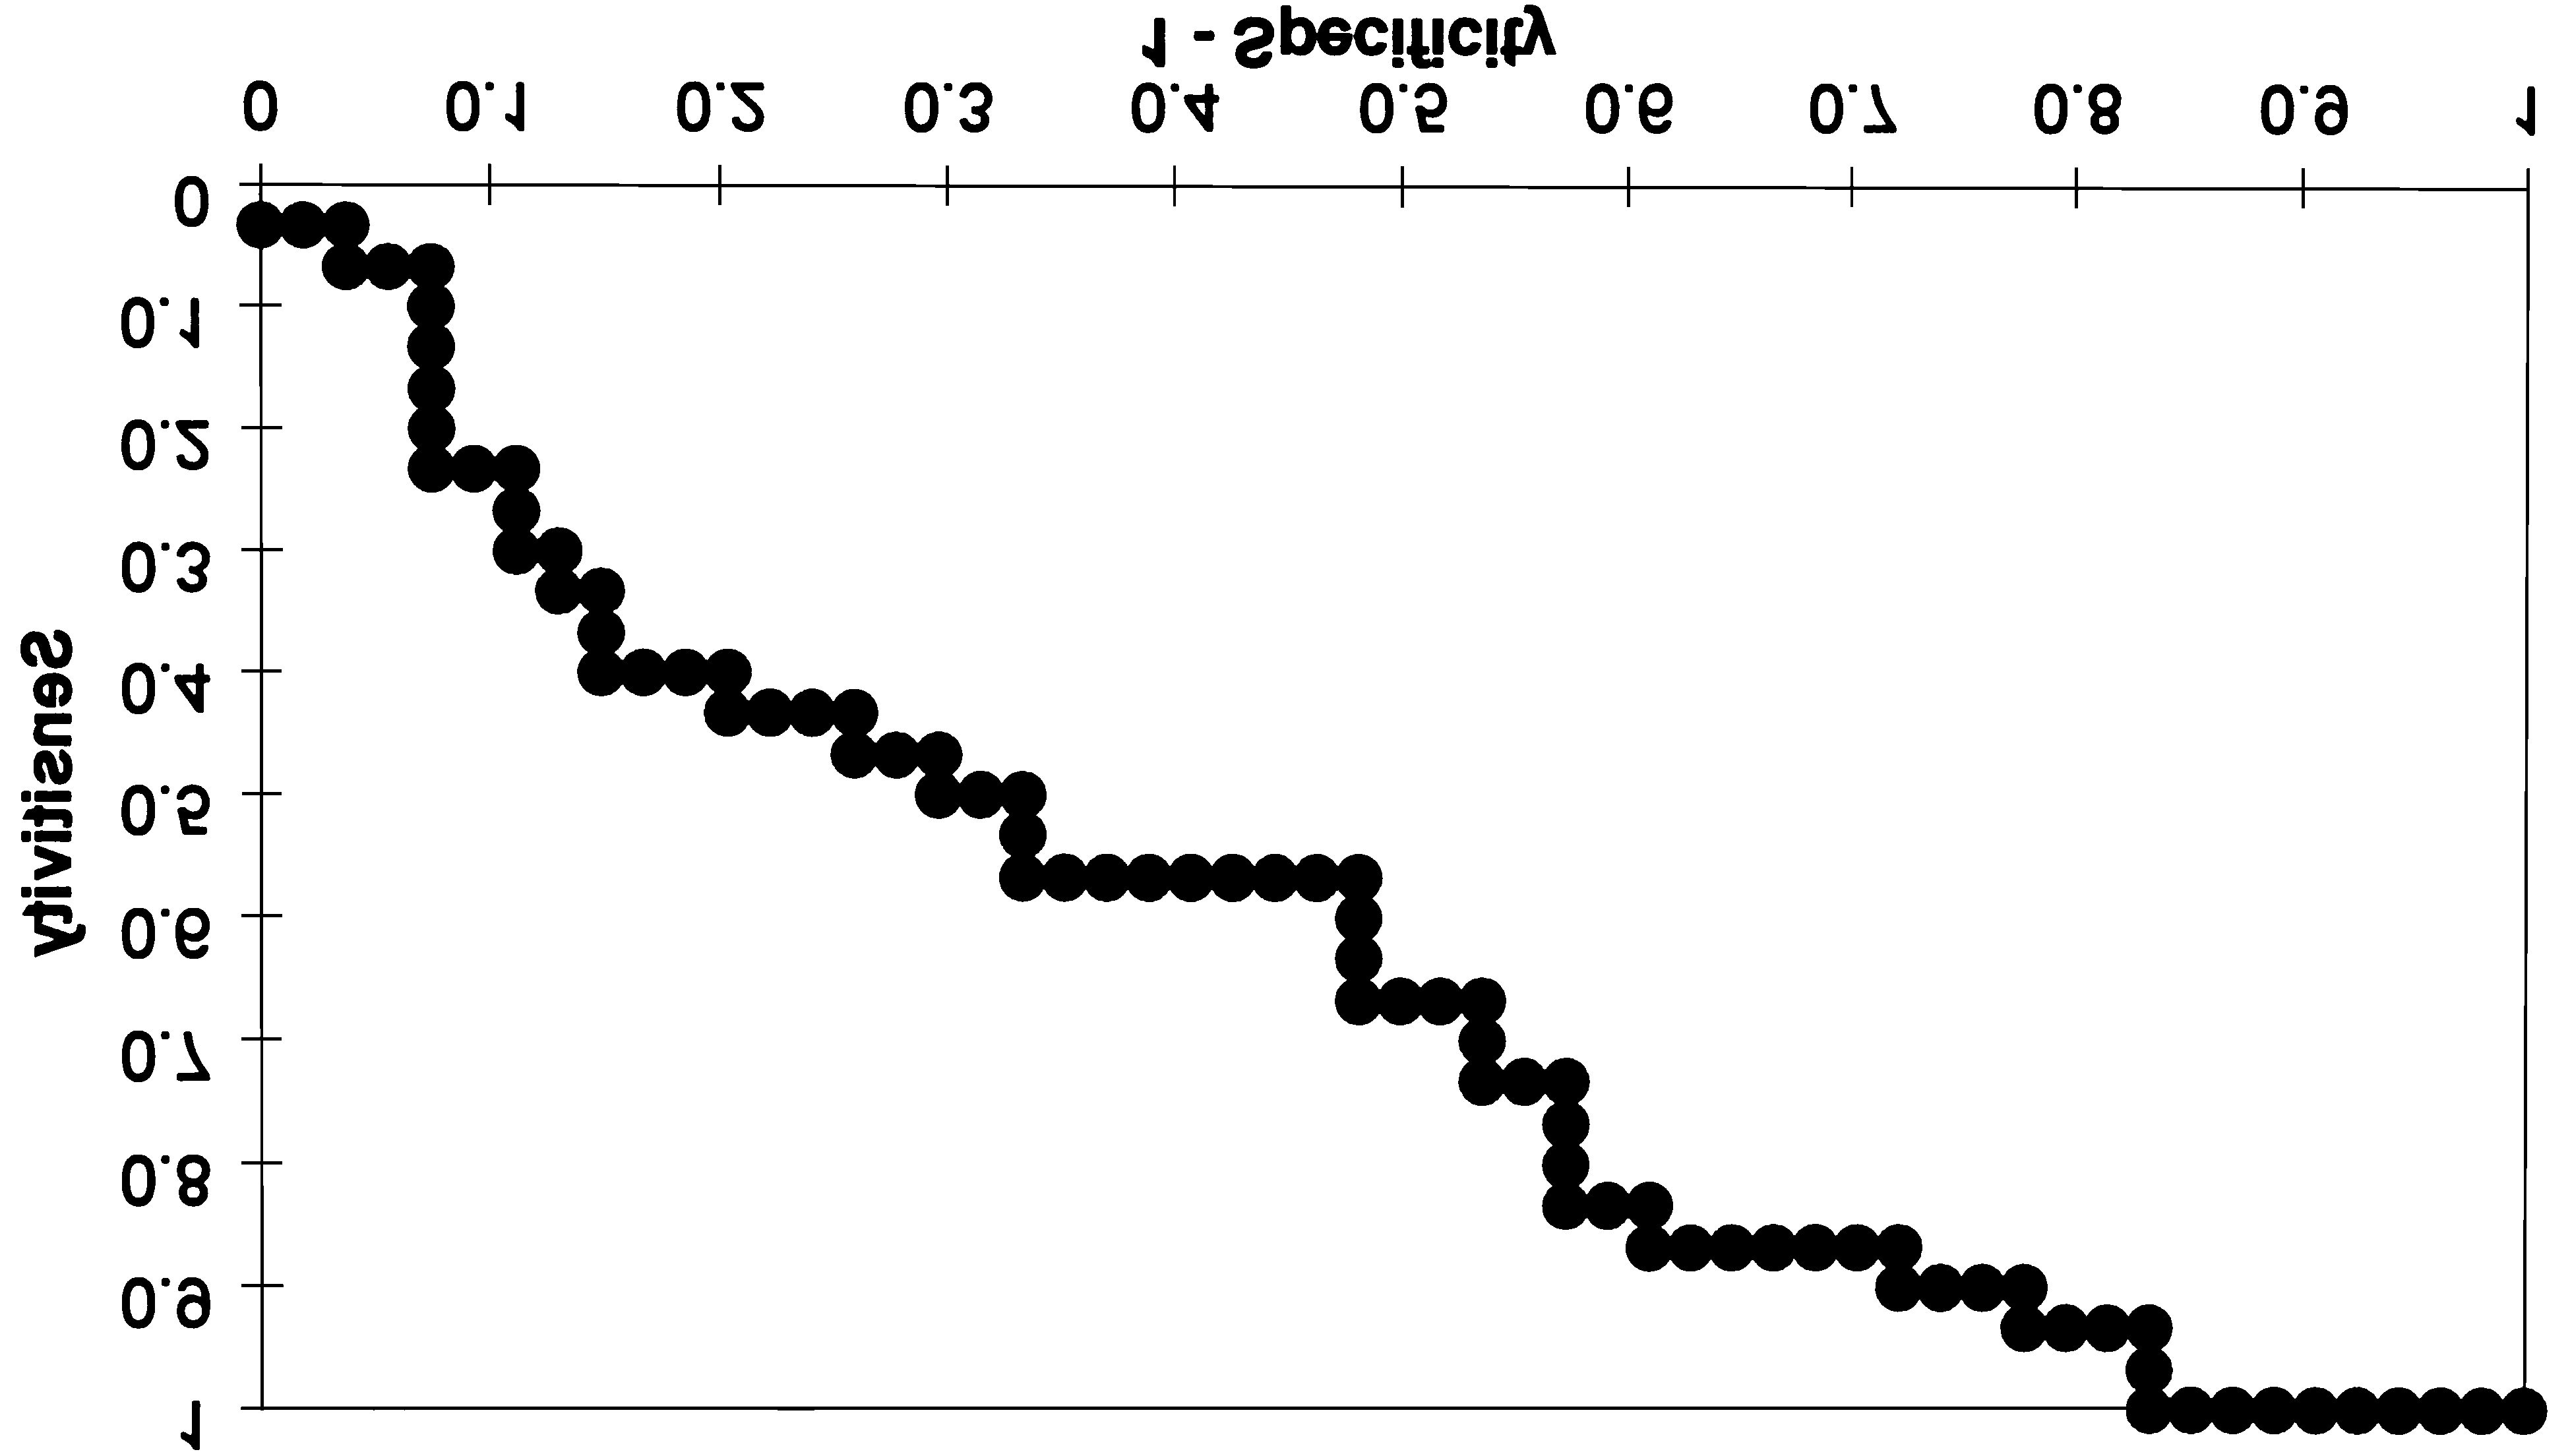
 MONITORING TACROLIMUS BLOOD CONCENTRATIONS
Table IV Summary of Cox Proportional Hazards Analysis
MONITORING TACROLIMUS BLOOD CONCENTRATIONS
Table IV Summary of Cox Proportional Hazards Analysis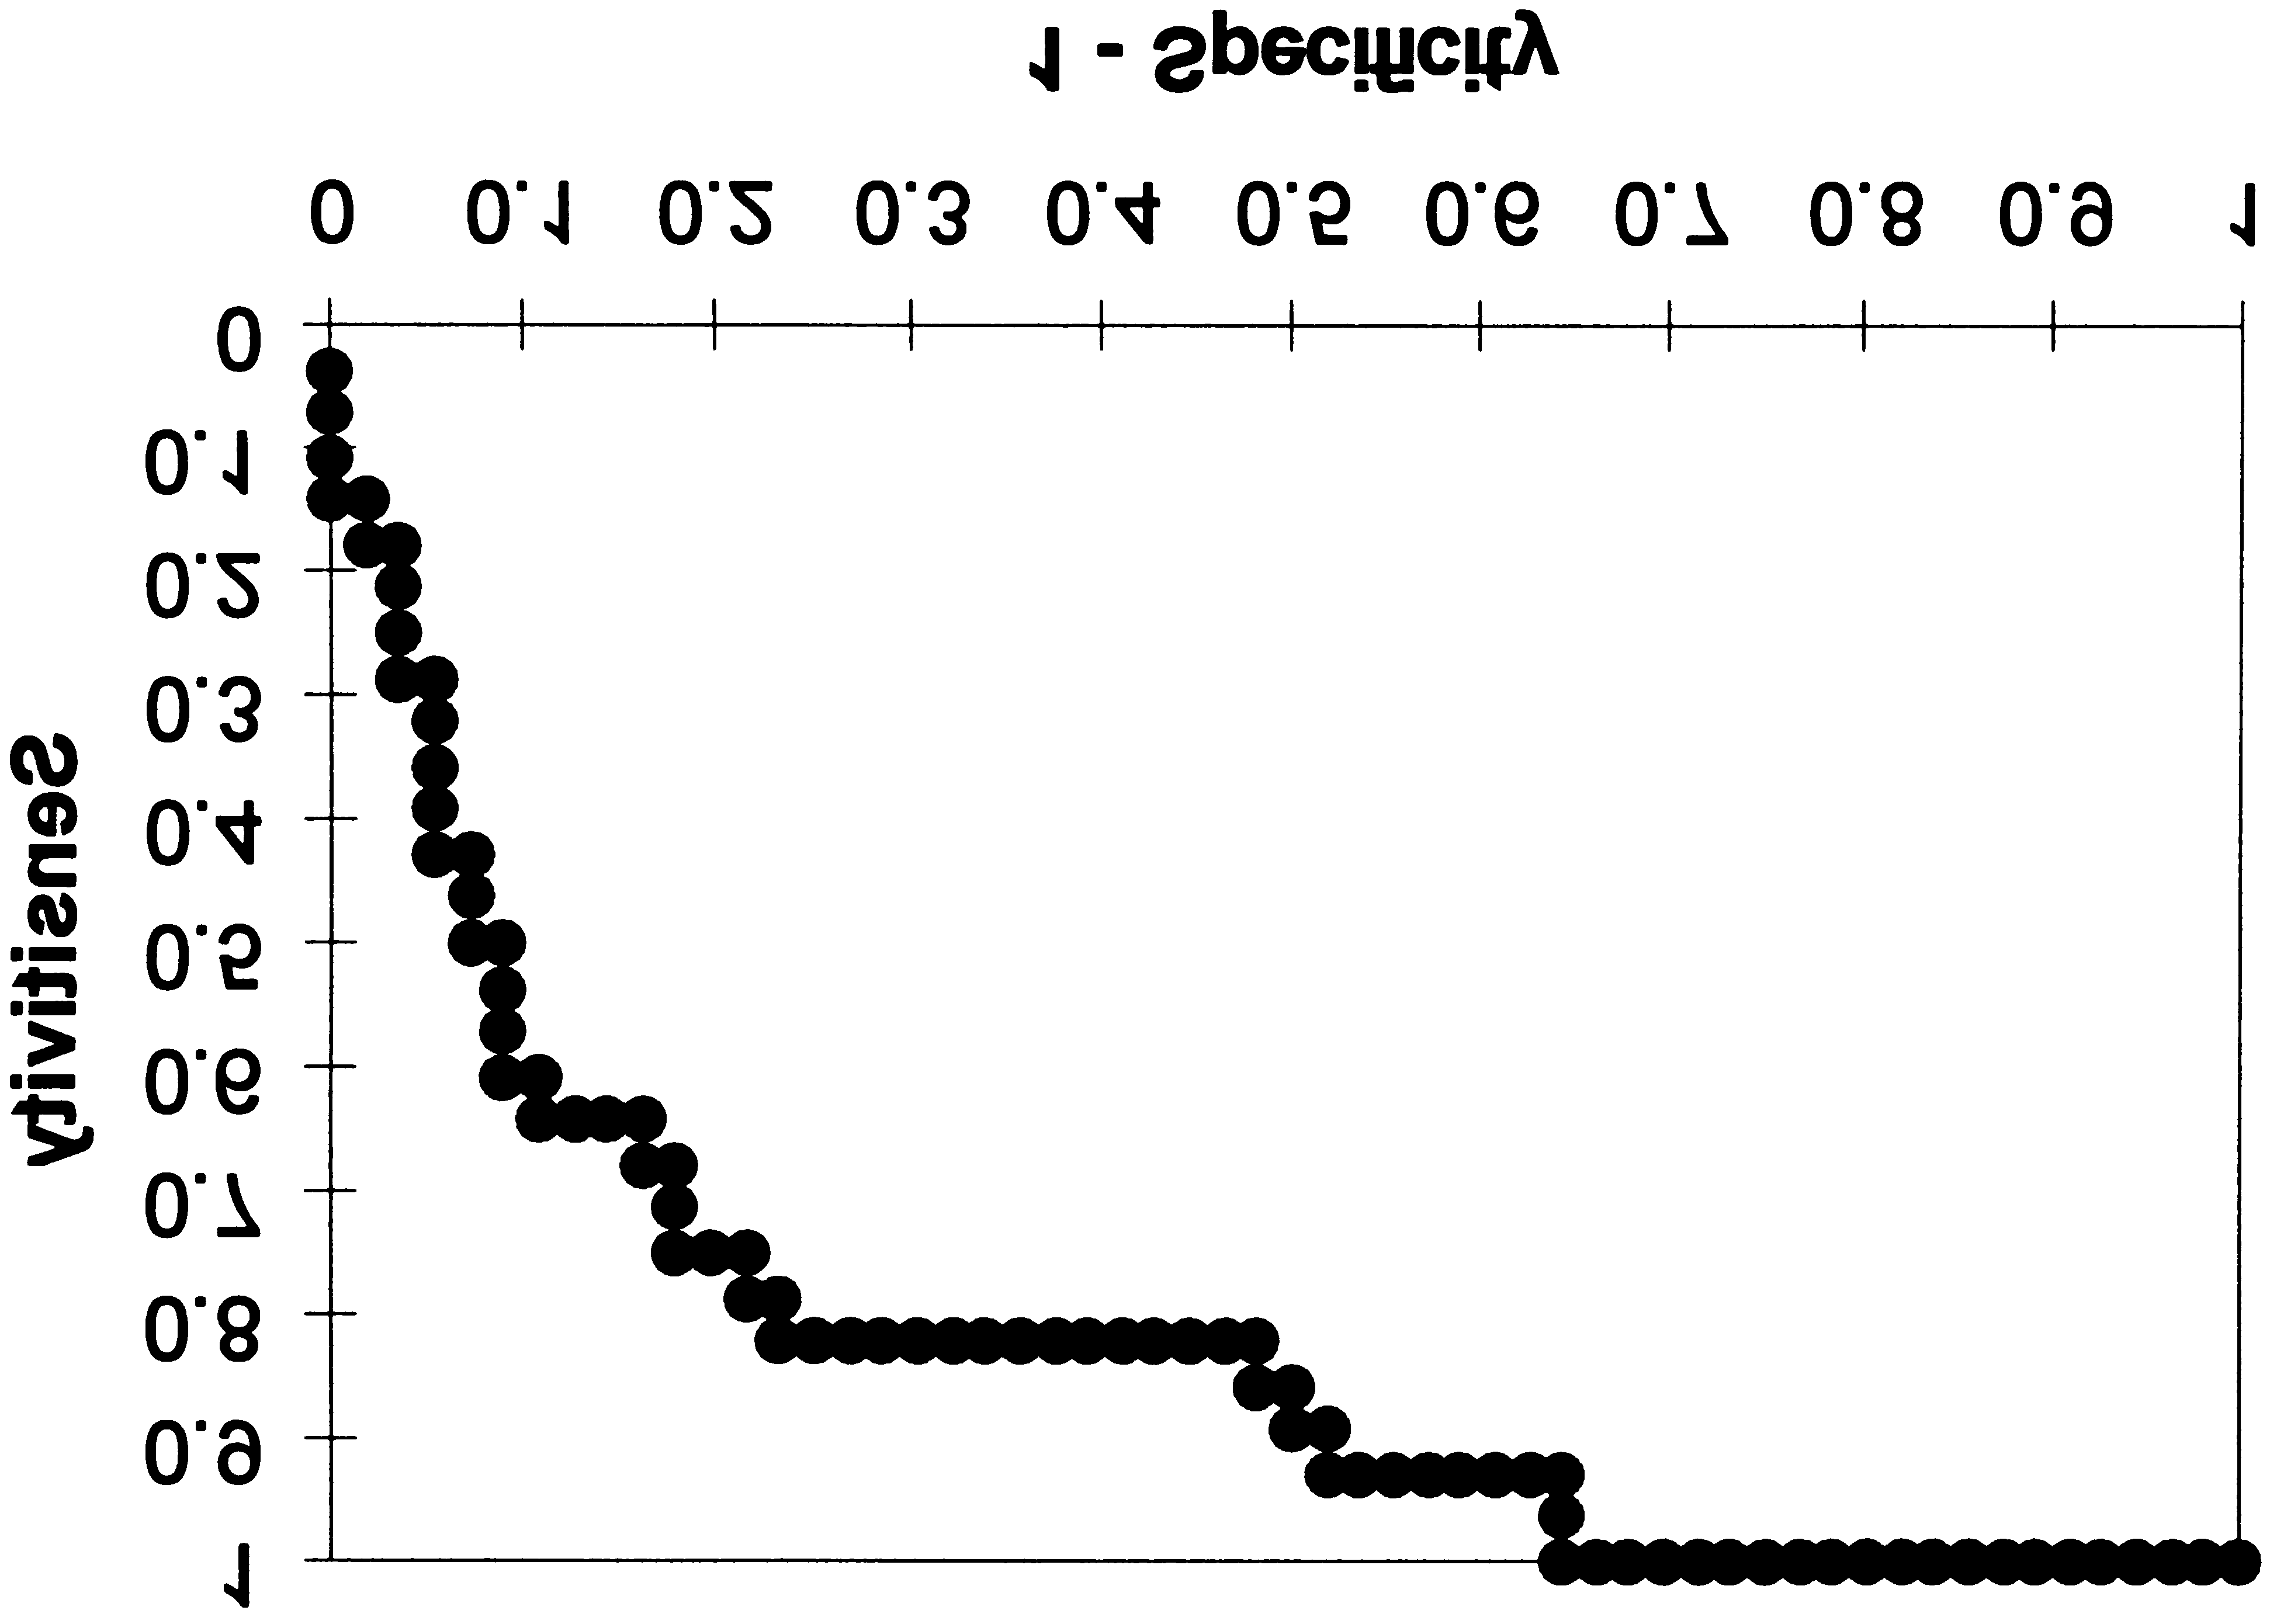
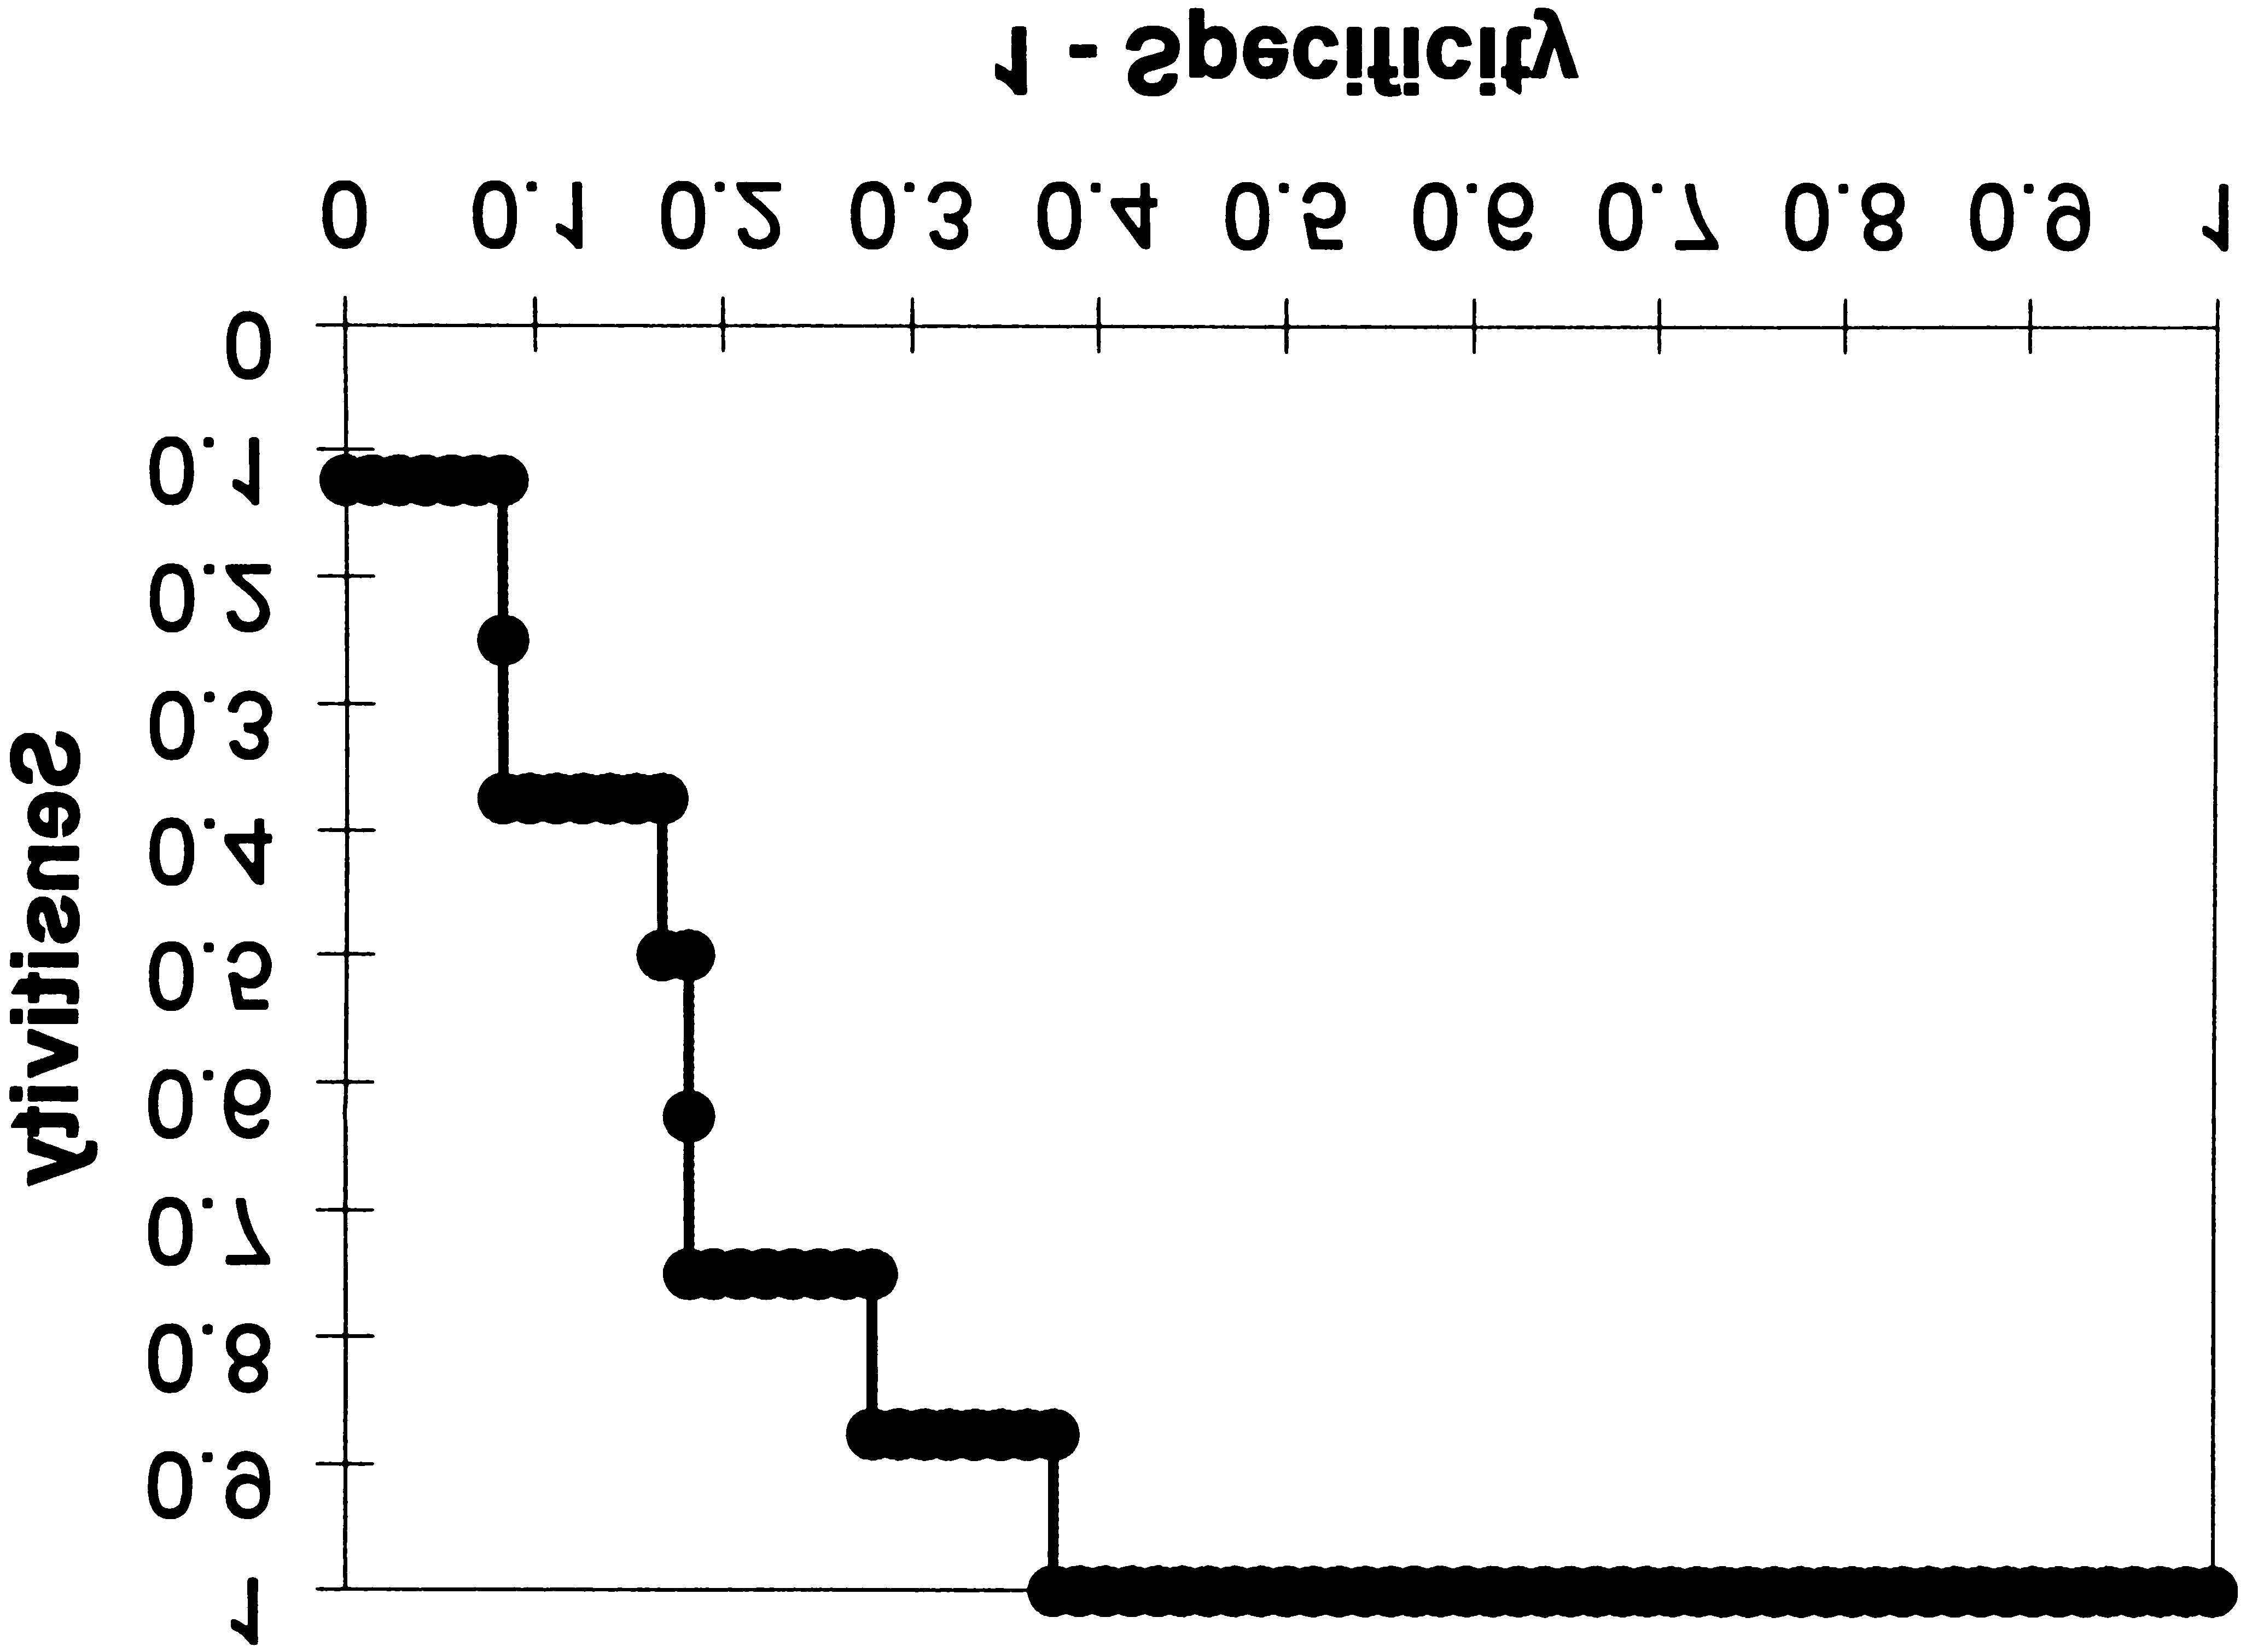 Figure 5. Receiver operating characteristic curve for nephrotoxicity
Figure 6. Receiver operating characteristic curve for toxicity with
with trough level in the 0- to 7-day window.
trough level in the 0- to 7-day window. This curve describes thattrough levels can differentiate adverse effect from a nonevent.
centrations of 15 ng/mL, which demonstrate higher
variation in the pharmacokinetics, and the need for
positive predictive values and greater specificity, are
long-term compliance to ensure graft survival in trans-
supported by current standards of practice.
Figure 5. Receiver operating characteristic curve for nephrotoxicity
Figure 6. Receiver operating characteristic curve for toxicity with
with trough level in the 0- to 7-day window.
trough level in the 0- to 7-day window. This curve describes thattrough levels can differentiate adverse effect from a nonevent.
centrations of 15 ng/mL, which demonstrate higher
variation in the pharmacokinetics, and the need for
positive predictive values and greater specificity, are
long-term compliance to ensure graft survival in trans-
supported by current standards of practice.