Am J Physiol Regul Integr Comp Physiol 290: R139 –R144, 2006;
CALL FOR PAPERS Metabolic Syndrome
Improvements in insulin resistance with weight loss, in contrast to
rosiglitazone, are not associated with changes in plasma adiponectin
Fahim Abbasi,1 Sang-Ah Chang,2 James W. Chu,1 Theodore P. Ciaraldi,2 Cindy Lamendola,1 Tracey McLaughlin,1 Gerald M. Reaven,1 and Peter D. Reaven3 1Department of Medicine, Stanford University School of Medicine, Stanford; 2Medical Research Service, Veterans Affairs San Diego Healthcare System and Division of Endocrinology and Metabolism, Department of Medicine, University of California, San Diego, California; and 3Medical Research Service, Division of Endocrinology and Metabolism, Department of Medicine, Carl T. Hayden Veterans Affairs Medical Center, Phoenix, Arizona
Submitted 22 April 2005; accepted in final form 30 August 2005
Abbasi, Fahim, Sang-Ah Chang, James W. Chu, Theodore P.
and underexpression of adiponectin alters insulin sensitivity in
Ciaraldi, Cindy Lamendola, Tracey McLaughlin, Gerald M.
animal models of insulin resistance (4, 29). Furthermore, in
Reaven, and Peter D. Reaven. Improvements in insulin resistance
vitro and in vivo studies have demonstrated several possible
with weight loss, in contrast to rosiglitazone, are not associated with
mechanisms for the beneficial actions of adiponectin, including
changes in plasma adiponectin or adiponectin multimeric complexes.
enhanced hepatic insulin sensitivity (4), an increase in fatty
Am J Physiol Regul Integr Comp Physiol 290: R139 –R144, 2006;
acid oxidation (9), and decreased inflammatory activity (20). In
doi:10.1152/ajpregu.00287.2005.—It has been suggested that changes
light of these observations, it has been suggested that interven-
in adiponectin levels may contribute to improved insulin sensitivity ininsulin-resistant individuals both after weight loss and after treatment
tions that improve insulin sensitivity may accomplish this
with thiazolidinedione compounds. If this is correct, then changes in
through modulation of adiponectin levels, and this notion is
total circulating adiponectin and/or distribution of its multimeric
consistent with evidence that plasma adiponectin concentra-
complexes should coincide with improvements in insulin sensitivity
tions increase when insulin-resistant individuals, either nondi-
after both interventions. To address this issue, fasting adiponectin
abetic or with Type 2 diabetes, are treated with thiazolidinedi-
concentrations and distribution of adiponectin complexes were mea-
sured in plasma samples in 24 insulin-resistant, nondiabetic subjects
On the other hand, not all interventions that enhance insulin
before and after 3– 4 mo of treatment with either rosiglitazone or
sensitivity are associated with significant changes in plasma
caloric restriction. The degree of insulin resistance in each group of 12
adiponectin concentrations. For example, plasma adiponectin
subjects was equal at baseline and improved to a similar extent
levels do not significantly increase in response to two thera-
(ϳ30%) after each therapy. Whereas total adiponectin levels in-
peutic modalities that clearly improve insulin action, namely,
creased by nearly threefold and the relative amount of several higher
moderate weight loss (ϳ8.0 kg) (2, 28) and increases in
molecular weight adiponectin complexes increased significantly in the
physical activity (14, 18, 31). There are several possible
rosiglitazone treatment group, there were no discernible changes inadiponectin levels or in the distribution between high or low molec-
explanations for these discrepant results. First, a functional
ular weight complexes in the weight loss group. These data indicate
peroxisome proliferator-activated receptor-responsive element
that, although changes in total adiponectin and several specific adi-
in the adiponectin promoter has recently been identified that is
ponectin complexes paralleled improvements in insulin resistance in
thought to play a significant role in the transcriptional activa-
thiazolidinedione-treated subjects, neither circulating adiponectin
tion of adiponectin gene in adipocytes (15). Thus it could be
concentrations nor multimeric complexes changed in association with
argued that the increase in adiponectin concentrations in TZD-
enhanced insulin sensitivity after moderate weight loss in 12 insulin-
treated insulin-resistant individuals was a direct effect of the
drug itself, and changes in adiponectin are not responsible for
thiazolidinedione; adiponectin multimers; high molecular weight
improved insulin resistance resulting from all treatment mo-
dalities. Second, the apparent divergent changes in plasmaadiponectin concentrations following moderate weight loss andincreased physical activity vs. TZD treatment could also be
ADIPONECTIN IS A ϳ30-kDa protein produced by adipocytes,
explained by differences in either the baseline degree of insulin
which circulates in plasma in multimeric aggregates of differ-
resistance and/or the improvement in insulin resistance after
ent sizes and has been closely associated with insulin action (7,
each of the interventions. Third, although adiponectin is syn-
25). Total circulating adiponectin levels have been shown to be
thesized as a ϳ30-kDa monomer, it circulates as a variety of
lower in insulin-resistant individuals (1, 27), and both over-
multimeric forms, including homotrimers (70 –90 kDa) andlarger oligomers, and a high molecular weight (HMW) form
Address for reprint requests and other correspondence: P. Reaven, Division
of Endocrinology and Metabolism, Dept. of Medicine (CS-111E), Carl T.
The costs of publication of this article were defrayed in part by the payment
Hayden Veterans Affairs Medical Center, 650 East Indian School Road,
of page charges. The article must therefore be hereby marked “advertisement”
Phoenix, Arizona 85012 (e-mail: [email protected]).
in accordance with 18 U.S.C. Section 1734 solely to indicate this fact.
consisting of six trimers (21). Evidence indicates that these
proximately one-third of the 490 nondiabetic subjects had SSPG
multimers vary in their biologic activities, and it has been
concentration values above 180 mg/dl.
suggested that the proportion of adiponectin in the HMW form
To accomplish the goals of our study, we selected 24 nondiabetic
is a more accurate indicator of insulin sensitivity than total
insulin-resistant subjects, matched for age and gender distribution,
adiponectin levels (21, 22). Therefore, there may be changes in
who had similar SSPG concentrations before and after administrationof rosiglitazone (n ϭ 12) or weight loss (n ϭ 12). Rosiglitazone-
the absolute or relative levels of various adiponectin multimers
treated subjects received 4 mg/day for 4 wk, followed by 8 mg/day for
that explain the improvement in insulin resistance accompany-
8 wk, while maintaining their usual diet. All baseline measurements
ing weight loss. Finally, because moderate weight loss (unlike
were repeated at the end of 12 wk of treatment. The weight loss group
TZD treatment) is not associated with changes in circulating
included volunteers with a BMI between 30.0 and 34.9 kg/m2. All
levels of adiponectin (2, 28), other factors may contribute to
subjects were instructed by a certified dietitian on calorie-restricted
improvements in insulin sensitivity in this setting. The present
diets calculated to lead to a weight loss of 0.5 kg/wk. The period of
study was initiated to evaluate these various possibilities and
weight loss was 4 mo in duration, during which time subjects were
involved directly comparing the changes in total plasma adi-
seen bimonthly to be weighed and receive dietary advice. At the
ponectin concentrations and the distribution of adiponectin
completion of the weight loss phase, subjects were instructed on a
multimers that were seen in response to TZD treatment with
weight-maintenance diet. After 2 wk of stable weight, all measure-
those before and after weight loss in insulin-resistant subjects
ments performed at baseline were repeated.
Plasma glucose and insulin levels were measured as described
that were matched for both baseline insulin resistance and the
previously (32). Plasma adiponectin levels were measured on blood
degree to which the defect in insulin action improved with each
samples drawn before the initiation of the insulin suppression test with
therapeutic intervention. If variations in adiponectin are largely
a radioimmunoassay established by Linco Research (St. Charles,
responsible for improvements in glucose metabolism following
MO). This assay has a sensitivity of 1 ng/ml, a range of 500 ng/ml to
most typical therapeutic interventions, then changes in plasma
100 g/ml, when samples are diluted 1/500 as per manufacturer’s
adiponectin and/or distribution of its complexes should reflect
instructions, and intra- and interassay coefficient of variation of Ͻ8%.
improvements in insulin sensitivity after both moderate weight
Analysis of the multimerization status of circulating adiponectin
was performed by size fractionation of plasma samples using SDS-PAGE under nonreducing, nondenaturing conditions, as described
MATERIALS AND METHODS
(with minor modifications) by Waki et al. (26). Plasma was combinedwith a 4ϫ Laemmli sample buffer, prepared without -mercaptoetha-
The study included 24 subjects selected from a larger group of
nol. Sample preparation was performed at room temperature. Sam-
volunteers who had participated in studies at Stanford University’s
ples, equivalent to 2 l of plasma, were size fractionated on 3– 8%
General Clinical Research Center examining the effect of weight loss
polyacrylamide gradient gels in a Tris-acetate system. Proteins were
(19) and treatment with rosiglitazone (5) on insulin resistance and
transferred to nitrocellulose membranes and blocked for 3 h at room
cardiovascular disease risk factors. Participants for these studies were
temperature with 5% milk in Tris-buffered saline, pH 7.5. Membranes
recruited from the San Francisco Bay area through advertisements in
were incubated with a monoclonal antibody against human adiponec-
local newspapers. Each volunteer signed a written informed consent
tin (BD Biosciences, Palo Alto, CA), at a 1:500 dilution for 1 h at
before admission to the General Clinical Research Center. All study
room temperature. The secondary antibody was anti-mouse IgG con-
participants were determined to be nondiabetic according to the
jugated with horseradish peroxidase (Amersham Biosciences, Buck-
criteria of the American Diabetes Association (5a) and were required
inghamshire, UK). Bands were detected using SuperSignal West Pico
to have normal findings on history, physical examination, and routine
chemiluminescent substrate (Pierce, Rockford, IL) and captured on
chemical screening battery, including hematocrit, creatinine, and ala-
Hyperfilm ECL film (Amersham Biosciences). Quantitative densitom-
nine transaminase levels. Degree of adiposity was assessed by body
etry was performed using ChemiImager software (Alpha Innotech,
mass index (BMI), and all subjects with BMI Ն35.0 kg/m2 were
San Leandro, CA), and, after subtracting the background density, data
excluded from the studies. Volunteers selected for the weight loss
were presented as average density per band. Each subject sample was
study were required to have a BMI of 30.0 –34.9 kg/m2. There were
run at least two or three separate times and yielded consistent results.
no specific BMI inclusion values for the rosiglitazone-treated group,
Bands were compared with HiMark Unstained HMW protein stan-
and BMI ranged from 21.9 to 34.8 kg/m2. The study protocol was
dards from Invitrogen (cat. no. LC5688). Manufacturer’s instructions
reviewed and approved by the Institutional Review Board at Stanford
were followed to visualize the bands using Coomassie blue. A single
lot of standards was used for all the gels. One limitation to the
Study subjects underwent an insulin suppression test to quantify
SDS-PAGE is the semiquantitive nature of the results. However, the
insulin-mediated glucose disposal as originally described (10) and
ability to assess multiple pre- and posttherapy samples on the same
validated by our research group. Briefly, after a 12-h overnight fast,
gels makes this approach an excellent method to directly compare the
subjects were infused for 180 min with octreotide acetate (0.27
g ⅐ mϪ2 ⅐ minϪ1), insulin (32 mIU ⅐ mϪ2 ⅐ minϪ1), and glucose (267
Summary statistics are described as means Ϯ SD. The two study
mg ⅐ mϪ2 ⅐ minϪ1). Blood was drawn at 10-min intervals from 150 to
groups were compared using Student’s unpaired t-test and -square
180 min of the infusion to measure plasma glucose and insulin
test. Within each study group, changes in clinical and metabolic
concentrations, and the means of these four values were used as the
variables were compared using Student’s paired t-test. Finally, Pear-
steady-state plasma insulin and glucose (SSPG) concentrations for
son’s correlation coefficients were calculated between the changes in
each individual. Because steady-state plasma insulin concentrations
SSPG and adiponectin concentrations in response to the interventions.
were similar in all subjects during these tests, the SSPG concentrationprovided a direct measure of the ability of insulin to mediate disposalof an infused glucose load; the higher the SSPG concentration, the
more insulin resistant the individual. On the basis of the results of theinsulin suppression test, participants with SSPG concentrations Ͼ180
Baseline characteristics of the study population are given in
mg/dl were defined as being insulin resistant and were eligible for this
Table 1. The groups were similar in terms of age, gender
study. This cutoff point was chosen based on the results of a previ-
distribution, SSPG, and fasting plasma glucose and insulin
ously reported distribution of SSPG concentrations (32) where ap-
concentrations. However, based on the inclusion criteria for the
AJP-Regul Integr Comp Physiol • VOL 290 • JANUARY 2006 • www.ajpregu.org
Table 1. Baseline characteristics of the study subjects
Values are means Ϯ SD for 12 subjects in each group. BMI, body mass
index; SSPG, steady-state plasma glucose.
two different intervention arms, BMI was greater in those whoparticipated in the weight loss program.
Table 2 compares the effects of the two experimental inter-
ventions on body weight, BMI, SSPG concentrations, andfasting plasma glucose and insulin concentrations. Participantsin the weight loss group lost an average of 7.4 kg (8% of initialweight, P Ͻ 0.001), whereas rosiglitazone-treated subjectsgained 1.3 kg (P ϭ 0.03). As a consequence of these changesin opposite directions, weight at the end of the study was nearlyidentical in the two groups.
SSPG concentrations were essentially identical in the two
groups before weight loss (Table 2), declined significantly andto a comparable degree after each intervention (29% vs. 30%),and were again quite similar at the end of the study. Inassociation with the improvement in insulin sensitivity, fastingplasma glucose and insulin concentrations decreased signifi-cantly (P Ͻ 0.05) and to a similar extent in both groups.
Figure 1 depicts plasma adiponectin concentrations before
and after the two experimental interventions. Mean baselineadiponectin levels were not statistically different (P ϭ 0.30)
Fig. 1. Effect of rosiglitazone treatment and weight loss on fasting plasmaadiponectin concentrations. Plasma adiponectin levels are presented in subjects
between the rosiglitazone-treated (10.9 Ϯ 5.0 g/ml) and
pre- and posttreatment with rosiglitazone (A) or weight loss (B). Individual
weight loss (9.0 Ϯ 3.2 g/ml) groups. Plasma adiponectin
data for each subject are shown, as are the mean values (bars) for each group.
concentration increased in every rosiglitazone-treated subject,
Statistical comparisons are between pre- and posttreatment values for each
with a tendency for the increment to be greatest in individuals
with the highest baseline values. The overall increase in adi-ponectin concentration after rosiglitazone treatment (to 24.8 Ϯ
ponectin concentrations at the end of the study were approxi-
11.6 g/ml) was highly statistically significant (P Ͻ 0.001),
mately threefold greater (24.8 Ϯ 11.6 g/ml, 95% confidence
and there was no relationship between the modest change in
interval of 17.4 –32.1, vs. 8.9 Ϯ 3.1 g/ml, 95% confidence
weight seen in these subjects and the increase in adiponectin
interval of 7.0 –10.8; P Ͻ 0.001) in rosiglitazone-treated sub-
after administration of rosiglitazone.
jects, despite the fact that both the improvement and the final
In marked contrast, plasma adiponectin concentrations re-
level of insulin sensitivity were similar in the two groups.
mained unchanged in association with the enhanced insulin
Furthermore, there was no correlation in the entire group
sensitivity following weight loss, with values increasing
between the improvement in insulin sensitivity and increases in
slightly in five subjects, decreasing slightly in six others, and
plasma adiponectin concentration in response to the experi-
not changing in one subject. As a consequence, plasma adi-
mental treatments (r ϭ 0.12, P ϭ 0.59).
Table 2. Effect of rosiglitazone treatment and weight loss on body weight and metabolic variables
Values are means Ϯ SD for 12 subjects in each group. RGZ, rosiglitazone treatment. *Baseline variables compared with those after the intervention; †changes
in the rosiglitazone treatment group compared with those in the weight loss group. AJP-Regul Integr Comp Physiol • VOL 290 • JANUARY 2006 • www.ajpregu.org
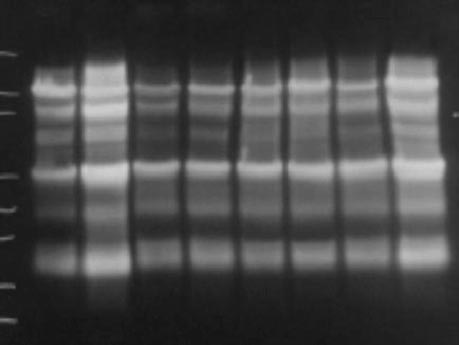
between the two groups were observed. First, the relativeamount or distribution of each adiponectin complex, expressedas percentage of total adiponectin for each individual, variedbetween groups at baseline. The major difference was that theweight loss group had a lower percentage of the HMW com-plex, whereas percentages of other complexes did not differbetween the two groups before the interventions. Second,whereas there were increases in the relative amounts of theHMW adiponectin band and the 200-kDa band in the rosigli-tazone group after treatment (Table 3), there was no such shiftin the distribution among adiponectin multimers from theplasma of the weight loss group. Representative examples ofthis are shown in Fig. 2. In support of this overall finding wasthe observation that the percentage of total adiponectin presentin the HMW complex increased after treatment in all 12 of thesubjects receiving rosiglitazone (with or without accompany-
Fig. 2. Evaluation of complexes of adiponectin multimers. Shown in a repre-
ing weight gain), whereas this only occurred in 3 of the 12
sentative image of Western blot gradient gel analysis of adiponectin multimers
subjects in the weight loss group. There was also a significant
from plasma of 2 subjects that were in the rosiglitazone (RGZ) treatment group
decrease in the percentage of total adiponectin present in the
and 2 subjects in the weight loss (WL) group. B, baseline; RGZ or WL,
ϳ170-kDa band in the rosiglitazone group. There were no
posttreatment. Under reducing conditions, the middle and higher molecular
other consistent changes in adiponectin multimer distribution
weight bands disappeared, consistent with the notion that these bands repre-sented higher-order mulitimers of adiponectin. Bands for the posttherapy
in rosiglitazone subjects, and there were no consistent changes
rosiglitazone group appear darker in general because there were overall
in the relative amounts of any adiponectin multimers in the
increases in the total amount of adiponectin. Relative distribution, as presented
in Table 3, adjusts for this difference. MW, molecular weight (as measured bymolecular mass in kDa). DISCUSSION
To assess whether changes in specific adiponectin multi-
A major goal of this study was to clarify the nature of the
meric complexes, rather than total plasma adiponectin concen-
relationship between plasma adiponectin concentrations and
tration, may have accounted for enhanced insulin sensitivity
resistance to insulin-mediated glucose disposal. Perhaps the
after either intervention, we compared relative levels of each of
most useful way to view our results from this perspective is to
the major adiponectin forms present in plasma as determined
begin by identifying areas of common agreement concerning
by density measurement of each band identified on the gradient
this issue. In this context, several previous studies have shown
gels. This analysis revealed seven or eight different bands
that improved insulin sensitivity following TZD treatment is
ranging in size from ϳ90 kDa, most probably the trimeric
associated with increases in plasma adiponectin concentrations
form, to a HMW form, Ͼ400 kDa (Fig. 2). If samples were
(3, 12, 22, 23, 33). More recently, Pajvani et al. (22) have
more extensively heated and denatured before addition to gels,
shown, using velocity sedimentation methodology to identify
the number of bands were typically reduced to the 30- and
circulating adiponectin complexes, that the increase in plasma
90-kDa forms (data not shown), consistent with a reduction in
adiponectin following TZD therapy in subjects with Type 2
multimerization of adiponectin as previously described (21,
diabetes or insulin resistance is also associated with greater
26). The averaged results from analysis of multiple gels are
amounts of larger multimeric forms of adiponectin. Similar to
shown in Table 3, and it can be seen that several differences
Waki et al. (26), we used a SDS-PAGE method to measure
Table 3. Effect of rosiglitazone treatment and weight loss on relative amount of individual adiponectin multimers in plasma
Values are means Ϯ SD and depict the amount of adiponectin multimer levels as % total adiponectin for each individual in the 12 subjects in each group.
Analysis of the multimerization status of circulating adiponectin was performed by size fractionation of plasma samples using SDS-PAGE under nonreducing,nondenaturing conditions, as described in MATERIALS AND METHODS. Bands were detected using a chemiluminescent substrate and compared with molecularweight standards. Quantitative densitometry comparisons were performed using ChemiImager software. Each gel included pre- and postsamples from individualsfrom both groups, as illustrated in Fig. 3. Although bands were relatively consistent in their distribution (and reproducible on gels run under similar conditions),some bands such as the 130-kDa band were present in very low in amounts and were only seen in some subjects. *and †, see Table 2. AJP-Regul Integr Comp Physiol • VOL 290 • JANUARY 2006 • www.ajpregu.org
adiponectin complex distribution in plasma, and our results are
disposal, they account for Ͻ 40% of the variability from person
quite similar to those of Pajvani et al. (22) in that we also
to person when insulin-mediated glucose disposal is measured
observed an increase in the very highest molecular mass band
directly (32). The limitation of insulin concentrations as indi-
and, to a lesser extent, in a 200-kDa band, whereas they
cators of insulin action is accentuated in obese individuals
described an increase in adiponectin complexes that appears to
because obesity, per se, results in decreased insulin clearance
include a range of HMW adiponectin complexes (22). The
(8, 16). Thus large amounts of weight loss will result in lower
most likely explanation for the relatively minor discrepancies
insulin concentrations, in excess of any associated improve-
between the results of the two studies is the difference in the
ment in insulin sensitivity, and their use in this situation cannot
methods used to measure adiponectin mulitimers.
provide reliable estimates of insulin action. It is also worth
Thus there is general agreement that TZD treatment is
noting that the increment in adiponectin concentration follow-
associated with enhanced insulin sensitivity, higher plasma
ing massive weight loss was substantially less than that de-
adiponectin concentrations, and an increase in HMW forms of
scribed following TZD administration (13, 17, 33). Thus,
adiponectin. Although there is accumulating evidence that
although changes in plasma adiponectin concentration may
TZD-associated changes in adiponectin concentration and/or
vary as a function of the amount of weight lost, insulin
multimer distribution may mediate improved insulin sensitiv-
sensitivity can improve after moderate weight loss in the
ity, it remains possible that the changes in insulin action and
absence of any change in plasma adiponectin, and the increase
adiponectin concentration and size distribution represent sep-
in adiponectin concentration with even massive weight loss is
arate and unrelated TZD effects. Consistent with this possibil-
attenuated compared with the changes seen after TZD treat-
ity was our inability to discern a significant relationship
following TZD administration between the enhanced insulin
In contrast to previous studies, ours was explicitly designed
sensitivity and the changes in plasma adiponectin concentra-
to elucidate the relationship between adiponectin and treat-
tion. The results of the recent report by Hammarstedt et al. (12)
ment-induced changes in insulin sensitivity. Furthermore, ours
also show that insulin sensitivity improves, associated with
is the only study that directly compared the effects of rosigli-
increases in plasma adiponectin concentration and a shift to a
tazone administration vs. those of moderate weight loss on
HMW form, subsequent to pioglitazone administration in in-
both insulin action and adiponectin concentration and its mul-
sulin-resistant, nondiabetic individuals. However, as was the
timeric complex distribution. Finally, the impact of the two
case with our study, there was no relationship between the
treatments was compared in insulin-resistant, nondiabetic sub-
enhanced insulin sensitivity and the changes in adiponectin
jects, well matched at baseline for age, gender, and degree of
amount or multimer distribution. It is possible that the lack of
insulin resistance. The similarity of the two groups before
a relationship between changes in insulin action and adiponec-
treatment permits us to more confidently compare the impact of
tin concentration is due to the relatively few number of patients
the two interventions on the relationship between treatment-
in both studies and/or the fact that they were all insulin
induced changes in insulin action and plasma adiponectin
resistant. In any event, there appears to be relative unanimity
concentrations. The results presented clearly demonstrate that
concerning the fact that administration of TZD compounds to
the relationship between these variables varied dramatically as
insulin-resistant individuals leads to enhanced insulin sensitiv-
a function of the intervention. Despite essentially identical
ity, increases in total adiponectin concentration, and a shift to
improvement in insulin sensitivity, the changes in plasma
HMW forms. What is not so clear is the nature and strength of
adiponectin concentrations were quite disparate. Whereas in-
the relationship between these metabolic changes.
creases in total adiponectin and several higher molecular
There is less agreement concerning the effect of weight loss
weight complexes paralleled improvements in insulin resis-
on plasma adiponectin concentrations. The results of the
tance in TZD-treated subjects, we report the novel finding that
present study, as well as previous findings of our research
no changes in adiponectin concentrations or molecular weight
group (2) and those of Xydakis et al. (28), indicate that insulin
complexes were observed when insulin sensitivity improved to
sensitivity improves after relatively moderate weight loss in the
a similar degree after weight loss. As indicated above, exer-
absence of any change in plasma adiponectin concentration. In
cise-mediated improvements in insulin sensitivity also appear
contrast, evidence has also been published that the improve-
independent of changes in total adiponectin levels (14, 18, 31).
ment in insulin action associated with weight loss is accompa-
Thus it is possible to dissociate improvements in insulin
nied by higher plasma adiponectin concentrations (6, 11, 30).
sensitivity from increases in adiponectin concentration, sup-
However, these studies differed from ours in two important
porting the notion that changes in adiponectin may not be
ways. First, the magnitude of obesity at baseline in these latter
instrumental in improving insulin resistance in all therapeutic
studies was much greater; bariatric surgery was used to induce
settings. As a corollary, it appears that other factors (e.g., other
weight loss, resulting in relatively massive amounts of weight
adipokines or cytokines produced in adipose tissue or else-
loss, i.e., 23 kg to almost 57 kg (6, 11, 30). This approach is
where) may play a role in the improvement in insulin-mediated
quite different from ours in which moderate calorie restriction
glucose disposal that occurs when insulin-resistant individuals
was instituted to bring about weight loss of 8 –9 kg. Further-
more, we directly measured the improvement in insulin sensi-tivity after moderate weight loss, whereas surrogate measures,
based on changes in plasma insulin concentration, were used toassess insulin action in those studies in which massive weight
This work was, in part, supported by the office of Research and Develop-
ment, Medical Research Service, Department of Veterans Affairs, and by
loss was associated with increases in plasma adiponectin con-
research grants from the Department of Veterans Affairs, the National Insti-
centration. Although these estimates of insulin action are
tutes of Health Grants RR-00070 and HL-067690, and the American Diabetes
correlated with specific measures of insulin-meditated glucose
AJP-Regul Integr Comp Physiol • VOL 290 • JANUARY 2006 • www.ajpregu.org
REFERENCES Y. PPAR␥ ligands increase expression and plasma concentrations of adiponectin, an adipose-derived protein. Diabetes 50: 2094 –2099, 2001.
1. Abbasi F, Chu JW, Lamendola C, McLaughlin T, Hayden J, Reaven
18. Marcell T, McAuley KA, Traustado´ttir T, and Reaven PD. Exercise GM, and Reaven PD. Discrimination between obesity and insulin resis-
training is not associated with improved levels of C-reactive protein or
tance in the relationship with adiponectin. Diabetes 53: 585–590, 2004.
adiponectin. Metabolism 54: 533–541, 2005.
2. Abbasi F, Lamendola C, McLaughlin T, Hayden J, Reaven GM, and
19. McLaughlin T, Abbasi F, Lamendola C, Carter S, Chu J, Basina M, Reaven PD. Plasma adiponectin concentrations do not increase in asso- Tuan C, and Reaven G. Weight loss in insulin resistant obese individ-
ciation with moderate weight loss in insulin-resistant, obese women.
uals: 60% vs. 40% carbohydrate diet (Abstract). Diabetes 52: A73, 2003. Metabolism 53: 280 –283, 2004.
20. Ouchi N, Kihara S, Arita Y, Okamoto 7. Ouchi N, Kihara S, Arita Y,
3. Bajaj M, Suraamornkul S, Piper P, Hardies LJ, Glass L, Cersosimo E, Okamoto Maeda K, Kuriyama H, Hotta K, Nishida M, Takahashi M, Pratipanawatr T, Miyazaki Y, and DeFronzo RA. Decreased plasma Muraguchi M, Ohmoto Y, Nakamura T, Yamashita S, Funahashi T,
adiponectin concentrations are closely related to hepatic fat content and
and Matsyzawa Y. Adiponectin, an adipocyte-derived plasma protein,
hepatic insulin resistance in pioglitazone-treated type 2 diabetic patients.
inhibits endothelial NF-B signaling through a cAMP-dependent pathway. J Clin Endocrinol Metab 89: 200 –206, 2004. Circulation 102: 1296 –1301, 2000.
4. Berg AH, Combs TP, Du X, Brownlee M, and Scherer PE. The
21. Pajvani UB, Du X, Combs TP, Berg AH, Rajala MW, Schulthess T,
adipocyte-secreted protein Acrp30 enhances hepatic insulin action. NatEngel J, Brownlee M, and Scherer PE. Structure-function studies of the
adipocyte-secreted hormone Acrp30/adiponectin. Implications for meta-
5. Chu JW, Abbasi F, Lamendola C, McLaughlin T, Reaven GM, and
bolic regulation and bioactivity. J Biol Chem 278: 9073–9085, 2003. Tsao PS. Effect of rosiglitazone treatment on circulating vascular and
22. Pajvani UB, Hawkins M, Combs TP, Rajala MW, Doebber T, Berger
inflammatory markers in insulin-resistant subjects. Diabetes Vasc Dis ResJP, Wagner JA, Wu M, Knopps A, Xiang AH, Utzschneider KM, Kahn SE, Olefsky JM, Buchanan TA, and Scherer PE. Complex
5a.Expert Committee on the Diagnosis and Classification of Diabetes Mellitus. Report of the Expert Committee on the Diagnosis, and Classi-
distribution, not absolute amount of adiponectin, correlates with thiazo-
fication of Diabetes Mellitus. Diabetes Care 26, Suppl 1: S5–S20, 2003.
lidinedione-mediated improvement in insulin sensitivity. J Biol Chem 279:
6. Faraj M, Havel PJ, Phelis S, Blank D, Sniderman AD, and Cianflone K. Plasma acylation-stimulating protein, adiponectin, leptin, and ghrelin
23. Phillips SA, Ciaraldi TP, Kong AP, Bandukwala R, Aroda V, Carter
before and after weight loss induced by gastric bypass surgery in morbidly
L, Baxi S, Mudaliar SR, and Henry RR. Modulation of circulating and
obese subjects. J Clin Endocrinol Metab 88: 1594 –1602, 2003.
adipose tissue adiponectin levels by antidiabetic therapy. Diabetes 52:
7. Fasshauer M and Paschke R. Regulation of adipocytokines and insulin
resistance. Diabetologia 46: 1594 –1603, 2003.
25. Tsao TS, Lodish HF, and Fruebis J. ACRP30, a new hormone control-
8. Ferrannini E, Natali A, Bell P, Cavallo-Perin P, Lalic N, and Min-
ling fat and glucose metabolism. Eur J Pharmacol 440: 213–221, 2002. grone G. On behalf of the European Group for the Study of insulin
26. Waki H, Yamauchi T, Kamon J, Ito Y, Uchida S, Kita S, Hara K,
Resistance (EGIR). Insulin resistance and hypersecretion in obesity. J ClinHada Y, Vasseur F, Froguel P, Kimura S, Nagai R, and Kadowaki T. Invest 100: 1166 –1173, 1997.
Impaired multimerization of human adiponectin mutants associated with
9. Fruebis J, Tsao TS, Javorschi S, Ebbets-Reed D, Erickson MRS, Yen
diabetes. Molecular structure and multimer formation of adiponectin. FT, Bihain BE, and Lodish HF. Proteolystic cleavage product of 30-kDa J Biol Chem 278: 40352– 40363, 2003.
adipocyte complement-related protein increases fatty acid oxidation in
27. Weyer C, Funahashi T, Tanaka S, Hotta K, Matsuzawa Y, Pratley
muscle and causes weight loss in mice. Proc Natl Acad Sci USA 98:
RE, and Tataranni PA. Hypoadiponectinemia in obesity and type 2
diabetes: close association with insulin resistance and hyperinsulinemia.
10. Greenfield MS, Doberne L, Kraemer F, Tobey T, and Reaven G. J Clin Endocrinol Metab 86: 1930 –1935, 2001.
Assessment of insulin resistance with the insulin suppression test and the
28. Xydakis AM, Case CC, Jones PH, Hoogeveen RC, Liu MY, Smith EO,
euglycemic clamp. Diabetes 30: 387–392, 1981. Lson KW, and Ballantyne CM. Adiponectin, inflammation, and the
11. Guldstrand M, Ahren B, and Adamson U. Improved -cell function
expression of the metabolic syndrome in obese individuals: the impact of
after standardized weight reduction in severely obese subjects. Am J
rapid weight loss through caloric restriction. J Clin Endocrinol Metab 89:
Physiol Endocrinol Metab 284: E557–E565, 2003.
12. Hammarstedt A, Sopasakis VR, Gogg S, Jansson PA, and Smith U.
29. Yamauchi T, Kamon J, Waki H, Terauchi Y, Kubota N, Hara K, Mori
Improved insulin sensitivity and adipose tissue dysregulation after short-
Y, Ide T, Murakami K, Tsuboyama-Kasaoka N, Ezaki O, Akanuma
term treatment with pioglitazone in non-diabetic, insulin-resistant sub-
Y, Gavrilova O, Vinson C, Reitman ML, Kagechika H, Shudo K,
jects. Diabetologia 48: 96 –104, 2005. Yoda M, Nakano Y, Tobe K, Nagai R, Kimura S, Tomita M, Froguel
13. Hirose H, Kawai T, Yamamoto Y, Taniyama M, Tomita M, Matsu- P, and Kadowaki T. The fat-derived hormone adiponectin reverses bara K, Okazaki Y, Ishii T, Oguma Y, Takei I, and Saruta T. Effects
insulin resistance associated with both lipoatrophy and obesity. Nat Med 7:
of pioglitazone on metabolic parameters, body fat distribution, and serum
adiponectin levels in Japanese male patients with type 2 diabetes. Metab-
30. Yang WS, Lee WJ, Funahashi T, Tanaka S, Matsuzawa Y, Chao CL, Chen CL, Tai TY, and Chuang LM. Weight reduction increases plasma
14. Hulver MW, Zheng D, Tanner CJ, Houmard JA, Kraus WE, Slentz
levels of an adipose-derived anti-inflammatory protein, adiponectin. J ClinCA, Sinha MK, Pories WJ, MacDonald KG, and Dohm GL. Adiponec- Endocrinol Metab 86: 3815–3819, 2001.
tin is not altered with exercise training despite enhanced insulin action.
31. Yatagai T, Nishida Y, Nagasaka S, Nakamura T, Tokuyama K, Am J Physiol Endocrinol Metab 283: E861–E865, 2002. Shindo M, Tanaka H, and Ishibashi S. Relationship between exercise
15. Iwaki M, Matsuda M, Maeda N, Funahashi T, Matsuzawa Y, Ma-
training-induced increase in insulin sensitivity and adiponectinemia in
kishima M, and Shimomura I. Induction of adiponectin, a fat-derived
healthy men. Endocr J 50: 233–238, 2003.
antidiabetic and antiatherogenic factor, by nuclear receptors. Diabetes 52:
32. Yeni-Komshian H, Carantoni M, Abbasi F, and Reaven GM. Rela-
tionship between several surrogate estimates of insulin resistance and
16. Jones CN, Abbasi F, Carantoni M, Polonsky KS, and Reaven GM.
quantification of insulin-mediated glucose disposal in 490 healthy nondi-
Roles of insulin resistance and obesity in regulation of plasma insulin
abetic volunteers. Diabetes Care 23: 171–175, 2000.
concentrations. Am J Physiol Endocrinol Metab 278: E501–E508, 2000.
33. Yu JG, Javorschi S, Hevener AL, Kruszynska YT, Norman RA, Sinha
17. Maeda N, Takahashi M, Funahashi T, Kihara S, Nishizawa H, M, and Olefsky JM. The effect of thiazolidinediones on plasma adiponec- Kishida K, Nagaretani H, Matsuda M, Komuro R, Ouchi N,
tin levels in normal, obese, and type 2 diabetic subjects. Diabetes 51:
Kuriyama H, Hotta K, Nakamura T, Shimomura I, and Matsuzawa AJP-Regul Integr Comp Physiol • VOL 290 • JANUARY 2006 • www.ajpregu.org
Dr. L. Mallesha Name: Dr. L. Mallesha Address: a) Office: JSS College of Arts, Commerce and Science b) Residence: Farm House, Paduguru, Gundlupet (T), Chamaraja nagar-571123 Contact No.: 7795101182 E-mail: [email protected] Qualification: M.Sc., Ph.D. Area of Specialization: Inorganic Chemistry Research Publication: 17 1. L. Mallesha , K. N. Mohana and
CHILD ASTHMA ASSESSMENT SELF-ADMINISTERED BY PARENT OR GUARDIAN VERSION Please do not complete the following form if: 1) You have completed this form in the past for this child Asthma Symptoms (continued) 2) You have never been told by a doctor or health provider that your 5. During the past 4 weeks, before the time child has asthma your child’s asthma began to worsen, how
 between the two groups were observed. First, the relativeamount or distribution of each adiponectin complex, expressedas percentage of total adiponectin for each individual, variedbetween groups at baseline. The major difference was that theweight loss group had a lower percentage of the HMW com-plex, whereas percentages of other complexes did not differbetween the two groups before the interventions. Second,whereas there were increases in the relative amounts of theHMW adiponectin band and the 200-kDa band in the rosigli-tazone group after treatment (Table 3), there was no such shiftin the distribution among adiponectin multimers from theplasma of the weight loss group. Representative examples ofthis are shown in Fig. 2. In support of this overall finding wasthe observation that the percentage of total adiponectin presentin the HMW complex increased after treatment in all 12 of thesubjects receiving rosiglitazone (with or without accompany-
Fig. 2. Evaluation of complexes of adiponectin multimers. Shown in a repre-
ing weight gain), whereas this only occurred in 3 of the 12
sentative image of Western blot gradient gel analysis of adiponectin multimers
subjects in the weight loss group. There was also a significant
from plasma of 2 subjects that were in the rosiglitazone (RGZ) treatment group
decrease in the percentage of total adiponectin present in the
and 2 subjects in the weight loss (WL) group. B, baseline; RGZ or WL,
ϳ170-kDa band in the rosiglitazone group. There were no
posttreatment. Under reducing conditions, the middle and higher molecular
other consistent changes in adiponectin multimer distribution
weight bands disappeared, consistent with the notion that these bands repre-sented higher-order mulitimers of adiponectin. Bands for the posttherapy
in rosiglitazone subjects, and there were no consistent changes
rosiglitazone group appear darker in general because there were overall
in the relative amounts of any adiponectin multimers in the
increases in the total amount of adiponectin. Relative distribution, as presented
in Table 3, adjusts for this difference. MW, molecular weight (as measured bymolecular mass in kDa).
between the two groups were observed. First, the relativeamount or distribution of each adiponectin complex, expressedas percentage of total adiponectin for each individual, variedbetween groups at baseline. The major difference was that theweight loss group had a lower percentage of the HMW com-plex, whereas percentages of other complexes did not differbetween the two groups before the interventions. Second,whereas there were increases in the relative amounts of theHMW adiponectin band and the 200-kDa band in the rosigli-tazone group after treatment (Table 3), there was no such shiftin the distribution among adiponectin multimers from theplasma of the weight loss group. Representative examples ofthis are shown in Fig. 2. In support of this overall finding wasthe observation that the percentage of total adiponectin presentin the HMW complex increased after treatment in all 12 of thesubjects receiving rosiglitazone (with or without accompany-
Fig. 2. Evaluation of complexes of adiponectin multimers. Shown in a repre-
ing weight gain), whereas this only occurred in 3 of the 12
sentative image of Western blot gradient gel analysis of adiponectin multimers
subjects in the weight loss group. There was also a significant
from plasma of 2 subjects that were in the rosiglitazone (RGZ) treatment group
decrease in the percentage of total adiponectin present in the
and 2 subjects in the weight loss (WL) group. B, baseline; RGZ or WL,
ϳ170-kDa band in the rosiglitazone group. There were no
posttreatment. Under reducing conditions, the middle and higher molecular
other consistent changes in adiponectin multimer distribution
weight bands disappeared, consistent with the notion that these bands repre-sented higher-order mulitimers of adiponectin. Bands for the posttherapy
in rosiglitazone subjects, and there were no consistent changes
rosiglitazone group appear darker in general because there were overall
in the relative amounts of any adiponectin multimers in the
increases in the total amount of adiponectin. Relative distribution, as presented
in Table 3, adjusts for this difference. MW, molecular weight (as measured bymolecular mass in kDa).